
KNOWPIA
WELCOME TO KNOWPIA

Matterhorn Peak 
Summary
Matterhorn Peak is located in the Sierra Nevada, in California, at the northern boundary of Yosemite National Park. At 12,285 feet (3,744 m) elevation, it is the tallest peak in the craggy Alps-like Sawtooth Ridge and the northernmost 12,000-foot (3,700 m) peak in the Sierra Nevada. The peak also supports the Sierra's northernmost glacier system. It was named after the Matterhorn in the Alps. Matterhorn Peak is near Twin Peaks, and just north of Whorl Mountain.
| Matterhorn Peak | |
|---|---|
 Looking west from Horse Creek | |
| Highest point | |
| Elevation | 12,285 ft (3,744 m) NAVD 88[1] |
| Prominence | 1,559 ft (475 m)[1] |
| Parent peak | Twin Peaks[2] |
| Listing | |
| Coordinates | 38°05′35″N 119°22′54″W / 38.0929700°N 119.3817903°W[6] |
| Geography | |
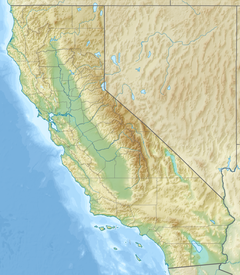 Matterhorn Peak Location in California | |
| Location | Mono / Tuolumne counties, California, U.S. |
| Parent range | Sierra Nevada |
| Topo map | USGS Matterhorn Peak |
| Climbing | |
| First ascent | 1899 by M. R. Dempster and party[7] |
| Easiest route | Scramble, class 2[7] |
The peak can be ascended without climbing gear.
In popular culture edit
Jack Kerouac, in The Dharma Bums (1958), describes a hike up and a run down the mountain. This led to the classic observation, "You can't fall off a mountain."[8]
Climate edit
| Climate data for Matterhorn Peak (CA) 38.0964 N, 119.3825 W, Elevation: 11,585 ft (3,531 m) (1991–2020 normals) | |||||||||||||
|---|---|---|---|---|---|---|---|---|---|---|---|---|---|
| Month | Jan | Feb | Mar | Apr | May | Jun | Jul | Aug | Sep | Oct | Nov | Dec | Year |
| Mean daily maximum °F (°C) | 31.3 (−0.4) |
29.5 (−1.4) |
32.2 (0.1) |
35.9 (2.2) |
43.5 (6.4) |
53.1 (11.7) |
61.0 (16.1) |
60.3 (15.7) |
55.0 (12.8) |
45.8 (7.7) |
36.7 (2.6) |
30.7 (−0.7) |
42.9 (6.1) |
| Daily mean °F (°C) | 21.3 (−5.9) |
19.5 (−6.9) |
21.8 (−5.7) |
24.7 (−4.1) |
31.8 (−0.1) |
41.1 (5.1) |
48.8 (9.3) |
48.1 (8.9) |
42.3 (5.7) |
34.3 (1.3) |
26.8 (−2.9) |
21.3 (−5.9) |
31.8 (−0.1) |
| Mean daily minimum °F (°C) | 11.4 (−11.4) |
9.5 (−12.5) |
11.3 (−11.5) |
13.5 (−10.3) |
20.1 (−6.6) |
29.0 (−1.7) |
36.6 (2.6) |
35.8 (2.1) |
29.6 (−1.3) |
22.7 (−5.2) |
16.8 (−8.4) |
12.0 (−11.1) |
20.7 (−6.3) |
| Average precipitation inches (mm) | 9.29 (236) |
8.06 (205) |
7.27 (185) |
3.97 (101) |
2.40 (61) |
0.69 (18) |
0.79 (20) |
0.69 (18) |
0.58 (15) |
2.54 (65) |
4.19 (106) |
8.11 (206) |
48.58 (1,236) |
| Source: PRISM Climate Group[9] | |||||||||||||
See also edit

References edit
- ^ a b "Matterhorn Peak, California". Peakbagger.com. Retrieved 2009-08-08.
- ^ "Matterhorn Peak". ListsOfJohn.com. Retrieved 2012-04-01.
- ^ "Sierra Peaks Section List" (PDF). Angeles Chapter, Sierra Club. Retrieved 2009-08-08.
- ^ "Vagmarken Sierra Crest List". Angeles Chapter, Sierra Club. Retrieved 2021-11-22.
- ^ "Western States Climbers Qualifying Peak List". Climber.org. Retrieved 2021-11-22.
- ^ "Matterhorn Peak". Geographic Names Information System. United States Geological Survey, United States Department of the Interior. Retrieved 2021-11-22.
- ^ a b Roper, Steve (1976). The Climber's Guide to the High Sierra. San Francisco: Sierra Club Books. pp. 48, 327. ISBN 978-0871561473.
- ^ Kerouac, Jack (2006). The Dharma bums. New York: Penguin Books. p. 64. ISBN 0-14-303960-1.
- ^ "PRISM Climate Group, Oregon State University". PRISM Climate Group, Oregon State University. Retrieved October 8, 2023.
To find the table data on the PRISM website, start by clicking Coordinates (under Location); copy Latitude and Longitude figures from top of table; click Zoom to location; click Precipitation, Minimum temp, Mean temp, Maximum temp; click 30-year normals, 1991-2020; click 800m; click Retrieve Time Series button.
External links edit
- "Matterhorn Peak". SummitPost.org.
- In the Footsteps of Jack Kerouac on Matterhorn Peak