
KNOWPIA
WELCOME TO KNOWPIA

Michigan's 1st Senate district 
Summary
Michigan's 1st Senate district is one of 38 districts in the Michigan Senate. It has been represented by Democrat Erika Geiss since 2023, succeeding fellow Democrat Stephanie Chang.[2][3]
| Michigan's 1st State Senate district | |||
|---|---|---|---|
 | |||
| Senator |
| ||
| Demographics | 44% White 47% Black 5% Hispanic 2% Asian 2% Other | ||
| Population (2018) | 249,358[1] | ||
Geography edit
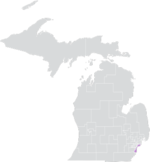
District 1 encompasses part of Wayne County.[4]
2011 Apportionment Plan edit
District 1, as dictated by the 2011 Apportionment Plan, covered parts of Wayne County along the Canadian border, including much of Detroit as well as River Rouge, Ecorse, Wyandotte, Riverview, Trenton, Woodhaven, Gibraltar, Grosse Ile, and parts of Brownstown.[5]
The district was split three ways among Michigan's 12th, 13th, and 14th congressional districts. It overlapped with the 1st, 2nd, 4th, 6th, 14th, and 23rd districts of the Michigan House of Representatives.[6]
Recent election results edit
2018 edit
| Primary election | ||||
|---|---|---|---|---|
| Party | Candidate | Votes | % | |
| Democratic | Stephanie Chang | 16,427 | 49.8 | |
| Democratic | Alberta Tinsley-Talabi | 8,710 | 26.4 | |
| Democratic | Bettie Cook Scott | 3,698 | 11.2 | |
| Democratic | James Cole Jr. | 1,717 | 5.2 | |
| Democratic | Stephanie Roehm | 1,464 | 4.4 | |
| Democratic | Nicholas Rivera | 941 | 2.9 | |
| Total votes | 32,957 | 100 | ||
| General election | ||||
| Democratic | Stephanie Chang | 62,071 | 72.0 | |
| Republican | Pauline Montie | 20,879 | 24.2 | |
| Green | David Bullock | 3,257 | 3.8 | |
| Total votes | 86,207 | 100 | ||
| Democratic hold | ||||
2014 edit
| Party | Candidate | Votes | % | |
|---|---|---|---|---|
| Democratic | Coleman Young II (incumbent) | 48,510 | 71.8 | |
| Republican | Barry Berk | 19,021 | 28.2 | |
| Total votes | 67,531 | 100 | ||
| Democratic hold | ||||
Federal and statewide results edit
| Year | Office | Results[8] |
|---|---|---|
| 2020 | President | Biden 70.4 – 28.3% |
| 2018 | Senate | Stabenow 72.0 – 26.1% |
| Governor | Whitmer 73.4 – 24.2% | |
| 2016 | President | Clinton 70.6 – 26.2% |
| 2014 | Senate | Peters 77.1 – 19.9% |
| Governor | Schauer 70.0 – 28.4% | |
| 2012 | President | Obama 78.0 – 21.4% |
| Senate | Stabenow 80.0 – 17.2% |
Historical district boundaries edit
This list is incomplete; you can help by adding missing items. (November 2022) |
| Map | Description | Apportionment Plan | Notes |
|---|---|---|---|
|
1964 Apportionment Plan | [9] | |
| 1972 Apportionment Plan | [10] | ||
| 1982 Apportionment Plan | [11] | ||
| 1992 Apportionment Plan | [12] | ||
|
2001 Apportionment Plan | [13] | |
 |
|
2011 Apportionment Plan | [14] |
References edit
- ^ "State Senate District 1, MI". Census Reporter. Retrieved May 15, 2020.
- ^ "Legislator Details - Erika Geiss". Library of Michigan. Retrieved January 1, 2023.
- ^ "Legislator Details - Stephanie Chang". Library of Michigan. Retrieved January 1, 2023.
- ^ "Linden_Senate". Michigan. Retrieved November 22, 2022.
- ^ "Michigan's 38 Senate Districts - 2011 Apportionment Plan" (PDF). Michigan Senate. Retrieved May 15, 2020.
- ^ David Jarman. "How do counties, House districts, and legislative districts all overlap?". Daily Kos. Retrieved May 15, 2020.
- ^ a b "Michigan State Senate District 1". Ballotpedia. Retrieved May 15, 2020.
- ^ "Daily Kos Elections Statewide Results by LD". Daily Kos. Retrieved May 15, 2020.
- ^ "Michigan Manual 1965/1966". Michigan Legislature. 1965. p. 376. Retrieved November 22, 2022.
- ^ "Michigan Manual 1975/1976". Michigan Legislature. 1975. p. 454. Retrieved November 22, 2022.
- ^ "SENATORIAL DISTRICTS" (PDF). Michigan Legislature. 1989. Retrieved November 22, 2022.
- ^ "SENATORIAL DISTRICTS" (PDF). Michigan Legislature. 1997. Retrieved November 22, 2022.
- ^ "SENATORIAL DISTRICTS" (PDF). Michigan Legislature. 2001. Retrieved November 22, 2022.
- ^ "MICHIGAN SENATE DISTRICT 1" (PDF). Archived from the original (PDF) on June 23, 2021. Retrieved November 22, 2022.