Oxford is a federal electoral district in Ontario , Canada, that has been represented in the House of Commons of Canada since the 1935 election .
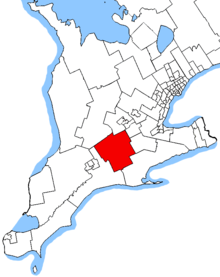
Oxford electoral district Oxford in relation to the southern Ontario ridings
Legislature House of Commons MP Arpan Khanna Conservative District created 1933 First contested 1935 Last contested 2023 (by-election) District webpage profile, map Population (2011 )[1] 108,656 Electors (2015)83,003 Area (km²)[2] 2,384 Pop. density (per km²) 45.6 Census division(s) Brant County , Oxford County Census subdivision(s) Brant , Woodstock , Tillsonburg , Ingersoll , Norwich , Zorra , South-West Oxford , East Zorra – Tavistock , Blandford-Blenheim
Demographics
edit
According to the 2021 Canadian census [3] Ethnic groups: 90.2% White, 3.2% South Asian, 2.3% Indigenous, 1.4% BlackLanguages: 89.2% English, 1.8% Dutch, 1.5% Punjabi, 1.2% French, 1.2% GermanReligions: 56.7% Christian (17.2% Catholic, 9.3% United Church, 5.0% Anglican, 3.1% Baptist, 2.8% Reformed, 2.6% Presbyterian, 1.6% Lutheran, 1.5% Anabaptist, 1.0% Pentecostal and other Charismatic, 12.6% Other), 1.7% Sikh, 39.4% NoneMedian income: $42,800 (2020)Average income: $50,760 (2020)
Geography
edit
The riding consists of the County of Oxford and a small portion of the County of Brant ,[4] Burford Township .
In the 2021 and 2019 elections, the Conservatives have won all parts of the riding, but were particularly strong in the rural southern part of the riding, with Burford Township and Norwich being their strongest areas. The weakest part of the riding for the Tories was in the riding's urban centres of Tillsonburg , Woodstock and Ingersoll where they only won pluralities. Liberal support is generally weak across the riding, but is the strongest in Woodstock and Tillsonburg, while the NDP has done particularly well in Ingersoll, winning over a quarter of the vote there in both elections. The People's Party saw a significant increase in their vote in 2021, with their strongest part of the riding being in Norwich.
History
edit
It was created in 1933 when the ridings of Oxford North and Oxford South were merged. It consisted initially of the county of Oxford, including the part of the village of Tavistock that lies in the county of Oxford.
In 1966, it was expanded to include the whole of the Village of Tavistock and the Town of Tillsonburg. In 1987, it was expanded to include the Township of Burford in the County of Brant. In 1996, it reverted to consisting of just the county of Oxford.
This riding gained territory from Brant during the 2012 electoral redistribution , consisting of that part of the County of Brant west of Etonia Road and East Quarter Townline Road.
Members of Parliament
edit
Election results
edit
Graph of election results in Oxford (parties that never received at least 2% of the vote are omitted)
Canadian federal by-election, June 19, 2023 Dave MacKenzie
Party
Candidate
Votes
%
Conservative Arpan Khanna 16,688
42.92
-4.13
Liberal David Hilderley
14,164
36.43
+15.90
New Democratic Cody Groat 4,053
10.42
-7.86
Christian Heritage John Markus
1,672
4.30
+3.53
People's Wendy Martin
1,278
3.29
-7.36
Green Cheryle Baker
854
2.20
-0.52
Independent John The Engineer Turmel 171
0.44
Total valid votes
38,880 99.38
Total rejected ballots
243 0.62 +0.01
Turnout
39,123 39.81 -25.08
Eligible voters
98,270
Conservative hold
Swing
-10.01
Source: Elections Canada [5]
2021 Canadian federal election
Party
Candidate
Votes
%
Expenditures
Conservative Dave MacKenzie 29,146
47.05
-1.09
$32,605.67
Liberal Elizabeth Quinto
12,720
20.53
+1.24
$25,550.39
New Democratic Matthew Chambers
11,325
18.28
-1.93
$3,373.85
People's Wendy Martin
6,595
10.65
+7.73
$15,390.08
Green Bob Reid
1,683
2.72
-5.12
$0.00
Christian Heritage Allen Scovil
479
0.77
-0.85
$5,613.11
Total valid votes/Expense limit
61,948 99.39 – $123,152.84
Total rejected ballots
379 0.61 -0.25
Turnout
62,327 64.89 -1.04
Eligible voters
96,055
Conservative hold
Swing
-1.17
Source: Elections Canada [6]
2019 Canadian federal election
Party
Candidate
Votes
%
Expenditures
Conservative Dave MacKenzie 29,310
48.14
+2.46
$49,710.46
New Democratic Matthew Chambers
12,306
20.21
+3.66
none listed
Liberal Brendan Knight
11,745
19.29
-12.90
$3,866.13
Green Lisa Birtch-Carriere
4,770
7.83
+4.31
none listed
People's Wendy Martin
1,774
2.91
-
$6,624.90
Christian Heritage Melody Aldred
986
1.62
-0.45
$3,632.07
Total valid votes/expense limit
60,891 99.14 –
Total rejected ballots
528 0.86 +0.44
Turnout
61,419 65.92 -2.00
Eligible voters
93,166
Conservative hold
Swing
-0.60
Source: Elections Canada [8] [9]
2015 Canadian federal election
Party
Candidate
Votes
%
Expenditures
Conservative Dave MacKenzie 25,966
45.67
-13.30
$75,795.63
Liberal Don McKay
18,299
32.19
+22.55
$36,173.57
New Democratic Zoe Kunschner
9,406
16.55
-8.90
$25,490.22
Green Mike Farlow
2,004
3.53
-0.80
$4,354.32
Christian Heritage Melody Ann Aldred
1,175
2.07
$8,421.76
Total valid votes/Expense limit
56,850 99.58 $220,586.55
Total rejected ballots
241 0.42 –
Turnout
57,041 67.93
Eligible voters
84,045
Conservative hold
Swing
-17.92
Source: Elections Canada [10] [11]
2011 Canadian federal election
Party
Candidate
Votes
%
Expenditures
Conservative Dave MacKenzie 27,973
58.90
+6.22
$56,267
New Democratic Paul Arsenault
12,164
25.61
+7.59
$14,065
Liberal Tim Lobzun
4,521
9.52
-9.87
$13,495
Green Mike Farlow
2,058
4.33
-3.24
$12,611
Christian Heritage John Markus
776
1.63
-0.71
$1,478
Total valid votes/Expense limit
47,492 99.62 $85,881.86
Total rejected ballots
179 0.38 +0.05
Turnout
47,671 61.88 +2.87
Eligible voters
77,035 – –
Conservative hold
Swing
-0.68
2008 Canadian federal election
Party
Candidate
Votes
%
Expenditures
Conservative Dave MacKenzie 23,330
52.68
+6.13
$57,473
Liberal Martha Dennis
8,586
19.39
-8.70
$50,017
New Democratic Diane Abbott
7,982
18.02
+0.65
$9,242
Green Cathy Mott
3,355
7.58
+4.43
$2,819
Christian Heritage Shaun MacDonald
1,036
2.34
-0.55
$14,229
Total valid votes/Expense limit
44,289 99.67 $82,866
Total rejected ballots
145 0.33 -0.00
Turnout
44,434 59.02 -8.12
Eligible voters
75,290 – –
Conservative hold
Swing
+7.41
Note: Change is from 2000 redistributed results. Conservative vote is compared to the combined Canadian Alliance and Progressive Conservative vote.
Note: Canadian Alliance vote is compared to the Reform vote in 1997 election. Independent compared to Christian Heritage.
Note: Progressive Conservative vote is compared to "National Government" vote in 1940 election.
Note: "National Government" vote is compared to Conservative vote in 1935 election.
See also
edit
References
edit
"Oxford (federal electoral district) (Code 35067) Census Profile". 2011 census Statistics Canada . Retrieved 3 March 2011 . Beatty, Bob (Summer 2008). "Oxford MPs: Confederation till Now" (PDF) . Oxford Update . Dave MacKenzie . p. 2. Retrieved 22 July 2009 . Riding history from the Library of Parliament
2011 results from Elections Canada
Campaign expense data from Elections Canada Notes
edit
^ Statistics Canada : 2012^ Statistics Canada : 2012^ Government of Canada, Statistics Canada (9 February 2022). "Profile table, Census Profile, 2021 Census of Population - Ottawa South [Federal electoral district (2013 Representation Order)], Ontario". www12.statcan.gc.ca . Retrieved 8 March 2023 . ^ "Oxford". ^ "June 19, 2023, by-elections—Official Voting Results". Elections Canada . Retrieved 13 November 2023 . ^ "forty-fourth general election 2021 — Poll-by-poll results". Elections Canada . Retrieved 1 June 2023 . ^ "Transposition of Votes from the 44th General Election to the 2023 Representation Orders". Elections Canada . Retrieved 9 April 2024 . ^ "List of confirmed candidates". Elections Canada . Retrieved 4 October 2019 . ^ "Official Voting Results". Elections Canada. Retrieved 27 July 2021 . ^ Elections Canada – Confirmed candidates for Oxford, 30 September 2015
^ "Elections Canada – Preliminary Election Expenses Limits for Candidates". Archived from the original on 15 August 2015. Retrieved 28 April 2020 . ^ Pundits' Guide to Canadian Elections
^ Election Prediction Project
43°04′N 80°36′W / 43.06°N 80.6°W / 43.06; -80.6