


Summary
The 2020 United States presidential election in Maryland was held on Tuesday, November 3, 2020, as part of the 2020 United States presidential election in which all 50 states plus the District of Columbia participated.[2] Maryland voters chose electors to represent them in the Electoral College via a popular vote, pitting the Republican Party's nominee, incumbent President Donald Trump, and running mate Vice President Mike Pence against Democratic Party nominee, former Vice President Joe Biden, and his running mate California Senator Kamala Harris. Maryland has 10 electoral votes in the Electoral College.[3]
| ||||||||||||||||||||||||||
| Turnout | 74.63% | |||||||||||||||||||||||||
|---|---|---|---|---|---|---|---|---|---|---|---|---|---|---|---|---|---|---|---|---|---|---|---|---|---|---|
| ||||||||||||||||||||||||||


| ||||||||||||||||||||||||||
| ||||||||||||||||||||||||||

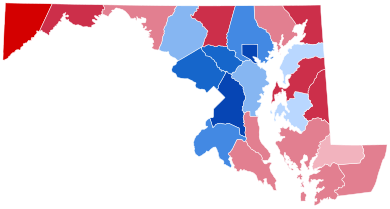
Biden easily carried Maryland with 65.4% of the vote to Trump's 32.2% (a margin of 33.2%, much improved from Hillary Clinton's 26.4% in 2016). Prior to the election, all news organizations handicapping the election considered Maryland a state that Biden would carry comfortably. Maryland has long been a Democratic-leaning state, and no Republican presidential candidate has won it since George H. W. Bush in 1988. Biden carried Black-majority Prince George's County and Baltimore City with almost 90% of the vote, and the suburban counties of Montgomery, Howard, and Baltimore with over 60% each. While Republicans typically win more counties by running up margins in more rural western Maryland and the Eastern Shore, the Baltimore-Washington area casts over three-fourths of the state's vote, making it difficult for a Republican to carry Maryland. While Trump won 14 of Maryland's 24 county-level jurisdictions, Biden won the six largest, all of which are part of the Baltimore-Washington area–Montgomery, Prince George's, Anne Arundel, Howard and Baltimore counties and Baltimore City–by over a million votes collectively, more than enough to carry the state.
Per exit polls by the Associated Press, Biden's principal strength in Maryland came from winning 94% of African-Americans, who represented 28% of the electorate. 74% of voters believed the criminal justice system needed a complete overhaul or major changes, and they opted for Biden by 73%. Biden won all other major demographic groups, including 52% of Whites (the first time since 1964 that a Democratic candidate won the white vote in Maryland), 69% of Latinos, 79% of Jews, 54% of Protestants, and 51% of Catholics.[4]
Biden flipped Frederick County in the Washington, D.C., exurbs and Talbot County on the Eastern Shore Democratic for the first time since 1964.[5] He also flipped Kent County on the Eastern Shore, home of Washington College, Democratic for the first time since 2008. In another college county on the Eastern Shore, Wicomico (home of Salisbury University), Trump won but was held below 50% of the vote for the first time for a Republican nominee since 1996.
Primary elections edit
The primary elections were originally scheduled for April 28, 2020. On March 17, they were moved to June 2 due to concerns over the COVID-19 pandemic.[6]
Republican primary edit
Donald Trump won the Republican primary, and thus received all of the state's 38 delegates to the 2020 Republican National Convention.[7]
Democratic primary edit
| Candidate | Votes | % | Delegates[9] |
|---|---|---|---|
| Joe Biden | 879,753 | 83.72 | 96 |
| Bernie Sanders (withdrawn) | 81,939 | 7.80 | |
| Elizabeth Warren (withdrawn) | 27,134 | 2.58 | |
| Pete Buttigieg (withdrawn) | 7,180 | 0.68 | |
| Michael Bloomberg (withdrawn) | 6,773 | 0.64 | |
| Andrew Yang (withdrawn) | 6,670 | 0.63 | |
| Amy Klobuchar (withdrawn) | 5,685 | 0.54 | |
| Tulsi Gabbard (withdrawn) | 4,226 | 0.40 | |
| Cory Booker (withdrawn) | 2,662 | 0.25 | |
| Michael Bennet (withdrawn) | 2,291 | 0.22 | |
| Marianne Williamson (withdrawn) | 897 | 0.09 | |
| Julian Castro (withdrawn) | 760 | 0.07 | |
| Tom Steyer (withdrawn) | 671 | 0.06 | |
| Deval Patrick (withdrawn) | 406 | 0.04 | |
| Uncommitted | 23,726 | 2.26 | |
| Total | 1,050,773 | 100% | 96 |
Green primary edit
| 2020 Maryland Green Party primary[10][11] | |||||||||||||||
|---|---|---|---|---|---|---|---|---|---|---|---|---|---|---|---|
| Candidate | Round 1 | Round 2 | Round 3 | Round 4 | |||||||||||
| Votes | % | Votes | % | Votes | % | Votes | % | ||||||||
| Howie Hawkins | 34 | 53.1% | 34 | 61.8% | 34 | 64.15% | 34 | 68% | |||||||
| Dario Hunter | 16 | 25% | 16 | 29.1% | 16 | 30.18% | 16 | 32% | |||||||
| Kent Mesplay | 2 | 3.1% | 3 | 5.5% | 3 | 5.66% | Eliminated | ||||||||
| Write-ins | 2 | 3.1% | 2 | 3.6% | Eliminated | ||||||||||
| Sedinam Moyowasiza-Curry | 1 | 1.6% | Eliminated | ||||||||||||
| Empty ballot | 9 | 14.1% | Eliminated | ||||||||||||
| Total votes | 64 | 100.0% | |||||||||||||
General election edit
Predictions edit
| Source | Ranking | As of |
|---|---|---|
| The Cook Political Report[12] | Safe D | September 10, 2020 |
| Inside Elections[13] | Safe D | September 4, 2020 |
| Sabato's Crystal Ball[14] | Safe D | July 14, 2020 |
| Politico[15] | Safe D | September 8, 2020 |
| RCP[16] | Safe D | August 3, 2020 |
| Niskanen[17] | Safe D | July 26, 2020 |
| CNN[18] | Safe D | August 3, 2020 |
| The Economist[19] | Safe D | September 2, 2020 |
| CBS News[20] | Likely D | August 16, 2020 |
| 270towin[21] | Safe D | August 2, 2020 |
| ABC News[22] | Safe D | July 31, 2020 |
| NPR[23] | Likely D | August 3, 2020 |
| NBC News[24] | Safe D | August 6, 2020 |
| 538[25] | Safe D | September 9, 2020 |
Polling edit
Graphical summary edit
Aggregate polls edit
| Source of poll aggregation |
Dates administered |
Dates updated |
Joe Biden Democratic |
Donald Trump Republican |
Other/ Undecided [a] |
Margin |
|---|---|---|---|---|---|---|
| 270 to Win | October 7–26 2020 | November 3, 2020 | 60.0% | 31.7% | 8.3% | Biden +28.3 |
| Real Clear Politics | September 4 – October 24, 2020 | November 3, 2020 | 60.3% | 31.0% | 8.7% | Biden +29.3 |
| FiveThirtyEight | until November 2, 2020 | November 3, 2020 | 63.1% | 31.6% | 5.3% | Biden +31.4 |
| Average | 61.1% | 31.4% | 7.4% | Biden +29.7 | ||
Polls edit
| Poll source | Date(s) administered |
Sample size[b] |
Margin of error |
Donald Trump Republican |
Joe Biden Democratic |
Jo Jorgensen Libertarian |
Howie Hawkins Green |
Other | Undecided |
|---|---|---|---|---|---|---|---|---|---|
| SurveyMonkey/Axios | Oct 20 – Nov 2, 2020 | 3,216 (LV) | ± 2.5% | 31%[c] | 66% | – | – | – | – |
| Swayable Archived November 27, 2020, at the Wayback Machine | Oct 23 – Nov 1, 2020 | 503 (LV) | ± 5.7% | 31% | 67% | 2% | 0% | – | – |
| SurveyMonkey/Axios | Oct 1–28, 2020 | 5,820 (LV) | – | 32% | 66% | – | – | – | – |
| Gonzalez Maryland Poll | Oct 19–24, 2020 | 820 (RV) | ± 3.5% | 33% | 58% | – | – | 3%[d] | 6% |
| Goucher College | Sep 30 – Oct 4, 2020 | 776 (LV) | ± 3.5% | 30% | 61% | 2% | 2% | 3%[e] | 2% |
| Change Research/Our Voice Maryland | Sep 29 – Oct 1, 2020 | 650 (V) | ± 4.55% | 32% | 61% | – | – | – | – |
| SurveyMonkey/Axios | Sep 1–30, 2020 | 2,364 (LV) | – | 31% | 67% | – | – | – | 2% |
| OpinionWorks | Sep 4–11, 2020 | 753 (LV) | – | 30% | 62% | – | – | 3%[d] | 5% |
| SurveyMonkey/Axios | Aug 1–31, 2020 | 1,813 (LV) | – | 31% | 66% | – | – | – | 3% |
| SurveyMonkey/Axios | Jul 1–31, 2020 | 1,911 (LV) | – | 32% | 66% | – | – | – | 2% |
| SurveyMonkey/Axios | Jun 8–30, 2020 | 1,175 (LV) | – | 34% | 64% | – | – | – | 2% |
| Gonzalez Maryland Poll | May 19–23, 2020 | 810 (LV) | ± 3.5% | 31% | 59% | – | – | – | 6% |
| Goucher College | Feb 13–19, 2020 | 718 (LV) | ± 3.6% | 35% | 60% | – | – | 1%[f] | 4%[g] |
Former candidates
| ||||||||||||||||||||||||||||||||||||||||||||||||||||||||||||||||||||||||||||||||||||||||||||||||||
|---|---|---|---|---|---|---|---|---|---|---|---|---|---|---|---|---|---|---|---|---|---|---|---|---|---|---|---|---|---|---|---|---|---|---|---|---|---|---|---|---|---|---|---|---|---|---|---|---|---|---|---|---|---|---|---|---|---|---|---|---|---|---|---|---|---|---|---|---|---|---|---|---|---|---|---|---|---|---|---|---|---|---|---|---|---|---|---|---|---|---|---|---|---|---|---|---|---|---|
|
with Donald Trump and Michael Bloomberg
with Donald Trump and Pete Buttigieg
with Donald Trump and Tulsi Gabbard
with Donald Trump and Amy Klobuchar
with Donald Trump and Bernie Sanders
with Donald Trump and Tom Steyer
with Donald Trump and Elizabeth Warren
|
Hypothetical polling
| ||||||||||||||||||||||||
|---|---|---|---|---|---|---|---|---|---|---|---|---|---|---|---|---|---|---|---|---|---|---|---|---|
|
with Donald Trump and Generic Democrat
|
Results edit
| Party | Candidate | Votes | % | ±% | |
|---|---|---|---|---|---|
| Democratic | Joe Biden Kamala Harris |
1,985,023 | 65.36% | +5.03% | |
| Republican | Donald Trump Mike Pence |
976,414 | 32.15% | -1.76% | |
| Libertarian | Jo Jorgensen Spike Cohen |
33,488 | 1.10% | -1.76% | |
| Green | Howie Hawkins Angela Walker |
15,799 | 0.52% | -0.77% | |
| Bread and Roses | Jerome Segal John de Graaf |
5,884 | 0.19% | N/A | |
| Write-in | 20,422 | 0.67% | -0.94% | ||
| Total votes | 3,037,030 | 100% | |||
Results by county edit
| County | Joe Biden Democratic |
Donald Trump Republican |
Various candidates Other parties |
Margin | Total votes cast | ||||
|---|---|---|---|---|---|---|---|---|---|
| # | % | # | % | # | % | # | % | ||
| Allegany | 9,158 | 29.89% | 20,886 | 68.16% | 597 | 1.95% | -11,728 | -38.27% | 30,641 |
| Anne Arundel | 172,823 | 55.82% | 127,821 | 41.28% | 8,973 | 2.90% | 45,002 | 14.54% | 309,617 |
| Baltimore County | 258,409 | 62.28% | 146,202 | 35.24% | 10,321 | 2.49% | 112,207 | 27.04% | 414,932 |
| Baltimore City | 207,260 | 87.28% | 25,374 | 10.69% | 4,827 | 2.03% | 181,886 | 76.59% | 237,461 |
| Calvert | 22,587 | 45.99% | 25,346 | 51.61% | 1,179 | 2.40% | -2,759 | -5.62% | 49,112 |
| Caroline | 5,095 | 32.26% | 10,283 | 65.11% | 416 | 2.63% | -5,188 | -32.85% | 15,794 |
| Carroll | 36,456 | 36.34% | 60,218 | 60.02% | 3,635 | 3.64% | -23,762 | -23.68% | 100,327 |
| Cecil | 16,809 | 35.42% | 29,439 | 62.03% | 1,214 | 2.56% | -12,630 | -26.61% | 47,462 |
| Charles | 62,171 | 69.47% | 25,579 | 28.58% | 1,748 | 1.95% | 36,592 | 40.89% | 89,498 |
| Dorchester | 6,857 | 42.92% | 8,764 | 54.85% | 356 | 2.23% | -1,907 | -11.93% | 15,977 |
| Frederick | 77,675 | 53.34% | 63,682 | 43.73% | 4,258 | 2.92% | 13,993 | 9.61% | 145,615 |
| Garrett | 3,281 | 21.02% | 12,002 | 76.88% | 328 | 2.10% | -8,721 | -55.86% | 15,611 |
| Harford | 63,095 | 42.58% | 80,930 | 54.61% | 4,161 | 2.81% | -17,835 | -12.03% | 148,186 |
| Howard | 129,433 | 70.70% | 48,390 | 26.43% | 5,239 | 2.86% | 81,043 | 44.27% | 183,062 |
| Kent | 5,329 | 49.37% | 5,195 | 48.13% | 270 | 2.50% | 134 | 1.24% | 10,794 |
| Montgomery | 419,569 | 78.61% | 101,222 | 18.96% | 12,952 | 2.43% | 318,347 | 59.65% | 533,743 |
| Prince George's | 379,208 | 89.26% | 37,090 | 8.73% | 8,557 | 2.01% | 342,118 | 80.53% | 424,855 |
| Queen Anne's | 10,709 | 35.35% | 18,741 | 61.87% | 840 | 2.77% | -8,032 | -26.52% | 30,290 |
| St. Mary's | 23,138 | 41.57% | 30,826 | 55.38% | 1,701 | 3.06% | -7,688 | -13.81% | 55,665 |
| Somerset | 4,241 | 41.80% | 5,739 | 56.56% | 167 | 1.65% | -1,498 | -14.76% | 10,147 |
| Talbot | 11,062 | 49.04% | 10,946 | 48.53% | 547 | 2.43% | 116 | 0.51% | 22,555 |
| Washington | 26,044 | 38.42% | 40,224 | 59.35% | 1,511 | 2.23% | -14,180 | -20.93% | 67,779 |
| Wicomico | 22,054 | 47.72% | 22,944 | 49.65% | 1,218 | 2.64% | -890 | -1.93% | 46,216 |
| Worcester | 12,560 | 39.63% | 18,571 | 58.60% | 560 | 1.77% | -6,011 | -18.97% | 31,691 |
| Totals | 1,985,023 | 65.36% | 976,414 | 32.15% | 75,593 | 2.49% | 1,008,609 | 33.21% | 3,037,030 |


Counties that flipped from Republican to Democratic edit
- Frederick (largest municipality: Frederick)
- Kent (largest municipality: Chestertown)
- Talbot (largest municipality: Easton)
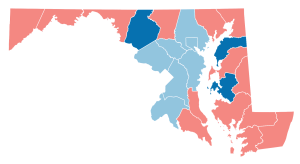
Results by congressional district edit
Biden won 7 of the state's 8 congressional districts. [27]
| District | Biden | Trump | Representative |
|---|---|---|---|
| 1st | 39.1% | 58.8% | Andy Harris |
| 2nd | 65.8% | 32.4% | Dutch Ruppersberger |
| 3rd | 68.7% | 29.4% | John Sarbanes |
| 4th | 79.1% | 19.2% | Anthony Brown |
| 5th | 68.6% | 29.7% | Steny Hoyer |
| 6th | 60.6% | 37.5% | David Trone |
| 7th | 78.4% | 20% | Kweisi Mfume |
| 8th | 69% | 28.9% | Jamie Raskin |
Analysis edit
Biden's performance was the strongest in Maryland for any candidate since Horatio Seymour's 67.2% in 1868. In terms of statewide vote share, Trump performed worse than any Republican since 1912, when the national Republican vote was split by former President Theodore Roosevelt's third-party run; even landslide losers Herbert Hoover in 1932, Alf Landon in 1936, and Barry Goldwater in 1964 managed higher vote shares than Trump's 32.15%. Apart from 1912, only in the antebellum elections of 1856 and 1860–when the Republican Party was not yet established in the slaveholding Old Line State–did the Republican nominee perform worse than Trump did in 2020. In this election, Maryland voted 28.75% to the left of the nation at-large.[28]
With the exception of Somerset County, every county in the state swung to Biden from Hillary Clinton's performance in 2016; many swung Democratic by double digits.[29] The Republican presidential vote share has now declined for four elections in a row in Maryland, the longest such current run for the party in any state. It was also one of five states in the nation in which Biden's victory margin was larger than one million raw votes: the others being California, New York, Massachusetts and Illinois.
See also edit
Notes edit
- ^ Calculated by taking the difference of 100% and all other candidates combined.
- ^ a b c d e f g h i Key:
A – all adults
RV – registered voters
LV – likely voters
V – unclear - ^ Overlapping sample with the previous SurveyMonkey/Axios poll, but more information available regarding sample size
- ^ a b "Someone else" with 3%
- ^ "Refused" with 3%
- ^ "Other" with 1%; would not vote with 0%
- ^ Includes "Refused"
- ^ "Neither Democratic nor Republican; will vote third party" with 2%; "refused" with 1%
References edit
- ^ "Official Turnout (By Party and County)" (PDF).
- ^ Kelly, Ben (August 13, 2018). "US elections key dates: When are the 2018 midterms and the 2020 presidential campaign?". The Independent. Archived from the original on August 2, 2018. Retrieved January 3, 2019.
- ^ "Distribution of Electoral Votes". National Archives and Records Administration. Retrieved January 3, 2019.
- ^ "Maryland Voter Surveys: How Different Groups Voted". The New York Times. November 3, 2020. ISSN 0362-4331. Retrieved November 9, 2020.
- ^ "County winners, 1836-2016". Google Docs. Retrieved November 15, 2020.
- ^ "Maryland postpones April 28 primary election over coronavirus". Politico. March 17, 2020.
- ^ "Maryland Republican Delegation 2020". The Green Papers. Retrieved June 3, 2020.
- ^ "2020 Presidential Primary Election Results". Maryland State Board of Elections. Retrieved October 14, 2020.
- ^ "Delegate Tracker". interactives.ap.org. Associated Press. Retrieved June 3, 2020.
- ^ "HOWIE HAWKINS WINS MARYLAND GREEN PARTY PRESIDENTIAL PRIMARY". Maryland Green Party. May 31, 2020. Retrieved June 3, 2020.
- ^ "2020 MGP Presidential Data" (PDF). May 31, 2020. Retrieved June 3, 2020.
- ^ "2020 POTUS Race ratings" (PDF). The Cook Political Report. Retrieved May 21, 2019.
- ^ "POTUS Ratings | Inside Elections". insideelections.com. Retrieved May 21, 2019.
- ^ "Larry J. Sabato's Crystal Ball » 2020 President". crystalball.centerforpolitics.org. Retrieved May 21, 2019.
- ^ "2020 Election Forecast". Politico. November 19, 2019.
- ^ "Battle for White House". RCP. April 19, 2019.
- ^ 2020 Bitecofer Model Electoral College Predictions Archived April 23, 2020, at the Wayback Machine, Niskanen Center, March 24, 2020, retrieved: April 19, 2020.
- ^ David Chalian; Terence Burlij (June 11, 2020). "Road to 270: CNN's debut Electoral College map for 2020". CNN. Retrieved June 16, 2020.
- ^ "Forecasting the US elections". The Economist. Retrieved July 7, 2020.
- ^ "2020 Election Battleground Tracker". CBS News. July 12, 2020. Retrieved July 13, 2020.
- ^ "2020 Presidential Election Interactive Map". 270 to Win.
- ^ "ABC News Race Ratings". CBS News. July 24, 2020. Retrieved July 24, 2020.
- ^ Montanaro, Domenico (August 3, 2020). "2020 Electoral Map Ratings: Trump Slides, Biden Advantage Expands Over 270 Votes". NPR.org. Retrieved August 3, 2020.
- ^ "Biden dominates the electoral map, but here's how the race could tighten". NBC News. August 6, 2020. Retrieved August 6, 2020.
- ^ "2020 Election Forecast". FiveThirtyEight. August 12, 2020. Retrieved August 14, 2020.
- ^ "2020 Election Results". Maryland State Board of Elections. Retrieved December 10, 2020.
- ^ "Daily Kos Elections' presidential results by congressional district for 2020, 2016, and 2012".
- ^ "Dave Leip's Atlas of U.S. Presidential Elections". uselectionatlas.org. Retrieved March 31, 2023.
- ^ "Presidential Election Results: Biden Wins". The New York Times. November 3, 2020. ISSN 0362-4331. Retrieved August 30, 2022.
Further reading edit
- Summary: State Laws on Presidential Electors (PDF), Washington DC: National Association of Secretaries of State, August 2020,
Maryland
External links edit
- Government Documents Round Table of the American Library Association, "Maryland", Voting & Elections Toolkits
- "Maryland: Election Tools, Deadlines, Dates, Rules, and Links", Vote.org, Oakland, CA
- "League of Women Voters of Maryland". (state affiliate of the U.S. League of Women Voters)
- Maryland at Ballotpedia