


Summary
The District of Columbia participated in the 2020 United States presidential election with the other 50 states on Tuesday, November 3.[2] District of Columbia voters chose electors to represent them in the Electoral College via a popular vote, pitting the Republican Party's nominee, incumbent President Donald Trump, and running mate Vice President Mike Pence against Democratic Party nominee, former Vice President Joe Biden, and his running mate California Senator Kamala Harris. The District of Columbia has three electoral votes in the Electoral College.[3] Prior to the election, Biden was considered to be all but certain to win D.C.
| ||||||||||||||||||||||||||
| Turnout | 66.9%[1] | |||||||||||||||||||||||||
|---|---|---|---|---|---|---|---|---|---|---|---|---|---|---|---|---|---|---|---|---|---|---|---|---|---|---|
| ||||||||||||||||||||||||||
 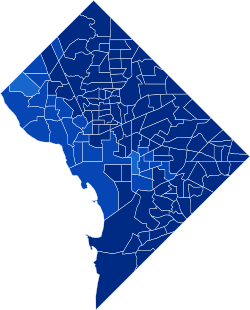
Biden 70–80% 80–90% 90–100%
| ||||||||||||||||||||||||||
| ||||||||||||||||||||||||||

The nation's capital is overwhelmingly Democratic and has voted for the Democratic nominee by massive margins in every presidential election it has participated in, ever since it was first granted electors by the passage of the Twenty-third Amendment in 1961. Biden's 86.75-point margin of victory was virtually identical to that secured by Hillary Clinton in 2016.[4] Nevertheless, the District shifted very slightly to the right compared with the previous election, making Biden the first non-incumbent Democrat since 1988 to win D.C. by a smaller margin than in the previous cycle. Along with six states,[a] it was one of just seven jurisdictions where Trump improved on his 2016 margins.
Primary elections edit
The District of Columbia held primary elections on June 2, 2020.
Republican primary edit
Donald Trump ran unopposed in the Republican primary, and thus received all of the district's 19 delegates to the 2020 Republican National Convention.[5]
Democratic primary edit


| Candidate | Votes | % | Delegates[7][8] |
|---|---|---|---|
| Joe Biden | 84,093 | 75.97 | 19 |
| Elizabeth Warren (withdrawn) | 14,228 | 12.85 | 1 |
| Bernie Sanders (withdrawn) | 11,116 | 10.04 | |
| Tulsi Gabbard (withdrawn) | 442 | 0.40 | |
| Write-in votes | 809 | 0.73 | |
| Total | 110,688 | 100% | 20 |
General election edit
Final predictions edit
| Source | Ranking |
|---|---|
| The Cook Political Report[9] | Solid D |
| Inside Elections[10] | Solid D |
| Sabato's Crystal Ball[11] | Safe D |
| Politico[12] | Solid D |
| RCP[13] | Solid D |
| Niskanen[14] | Safe D |
| CNN[15] | Solid D |
| The Economist[16] | Safe D |
| CBS News[17] | Likely D |
| 270towin[18] | Safe D |
| ABC News[19] | Solid D |
| NPR[20] | Likely D |
| NBC News[21] | Solid D |
| 538[22] | Solid D |
Polling edit
Graphical summary edit
Aggregate polls edit
| Source of poll aggregation |
Dates administered |
Dates updated |
Joe Biden Democratic |
Donald Trump Republican |
Other/ Undecided [b] |
Margin |
|---|---|---|---|---|---|---|
| FiveThirtyEight | until November 2, 2020 | November 3, 2020 | 90.8% | 5.8% | 3.4% | Biden +85.0 |
Polls edit
| Poll source | Date(s) administered |
Sample size[c] |
Margin of error |
Donald Trump Republican |
Joe Biden Democratic |
Jo Jorgensen Libertarian |
Howie Hawkins Green |
Other | Undecided |
|---|---|---|---|---|---|---|---|---|---|
| SurveyMonkey/Axios | Oct 20 – Nov 2, 2020 | 495 (LV) | ± 6% | 5%[d] | 94% | – | – | – | – |
| SurveyMonkey/Axios | Oct 1–28, 2020 | 969 (LV) | – | 9% | 89% | – | – | – | – |
| SurveyMonkey/Axios | Sep 1–30, 2020 | 343 (LV) | – | 12% | 86% | – | – | – | 2% |
| SurveyMonkey/Axios | Aug 1–31, 2020 | 252 (LV) | – | 16% | 83% | – | – | – | 2% |
| SurveyMonkey/Axios | Jul 1–31, 2020 | 290 (LV) | – | 8% | 91% | – | – | – | 1% |
| SurveyMonkey/Axios | Jun 8–30, 2020 | 151 (LV) | – | 11% | 87% | – | – | – | 3% |
Results edit
| Party | Candidate | Votes | % | ±% | |
|---|---|---|---|---|---|
| Democratic | Joe Biden Kamala Harris |
317,323 | 92.15 | +1.29 | |
| Republican | Donald Trump Mike Pence |
18,586 | 5.40 | +1.31 | |
| Write-in | 3,137 | 0.91 | –1.19 | ||
| Libertarian | Jo Jorgensen Spike Cohen |
2,036 | 0.59 | –0.99 | |
| DC Statehood Green | Howie Hawkins Angela Walker |
1,726 | 0.50 | –0.87 | |
| Independent | Gloria La Riva Sunil Freeman |
855 | 0.25 | +0.25 | |
| Independent | Brock Pierce Karla Ballard |
693 | 0.20 | +0.20 | |
| Total votes | 344,356 | 100.00 | +1.60 | ||
Results by ward edit
| County | Biden | Biden % |
Trump | Trump % |
Others | Others % |
Total |
|---|---|---|---|---|---|---|---|
| Ward 1 | 39,041 | 93.7% | 1,725 | 4.1% | 298 | 0.7% | 41,064 |
| Ward 2 | 29,078 | 88.4% | 2,918 | 8.9% | 370 | 1.1% | 32,366 |
| Ward 3 | 39,397 | 89.1% | 3,705 | 8.4% | 491 | 1.1% | 43,593 |
| Ward 4 | 42,489 | 93.8% | 1,913 | 4.2% | 308 | 0.7% | 44,710 |
| Ward 5 | 43,320 | 94.0% | 1,769 | 3.8% | 323 | 0.7% | 45,412 |
| Ward 6 | 56,719 | 90.1% | 4,337 | 6.9% | 857 | 1.4% | 61,913 |
| Ward 7 | 36,382 | 94.8% | 1,134 | 3.0% | 270 | 0.7% | 37,786 |
| Ward 8 | 30,897 | 94.0% | 1,085 | 3.3% | 220 | 0.7% | 32,202 |
Notes edit
- ^ Those states were Arkansas, California, Florida, Hawaii, Nevada, and Utah, as well as Washington, D.C.
- ^ Calculated by taking the difference of 100% and all other candidates combined.
- ^ Key:
A – all adults
RV – registered voters
LV – likely voters
V – unclear - ^ Overlapping sample with the previous SurveyMonkey/Axios poll, but more information available regarding sample size
See also edit
References edit
- ^ "General Election 2020 - Certified Results". D.C. Board of Elections.
- ^ Kelly, Ben (August 13, 2018). "US elections key dates: When are the 2018 midterms and the 2020 presidential campaign?". The Independent. Archived from the original on January 4, 2019. Retrieved January 3, 2019.
- ^ "Distribution of Electoral Votes". National Archives and Records Administration. September 19, 2019. Retrieved November 3, 2020.
- ^ "District of Columbia Election Results". The New York Times. November 3, 2020. ISSN 0362-4331. Retrieved November 9, 2020.
- ^ "District of Columbia Republican Delegation 2020". The Green Papers. Retrieved June 3, 2020.
- ^ "DCBOE Election Results". electionresults.dcboe.org. DC Board of Elections. Retrieved June 3, 2020.
- ^ "Live results: 2020 District of Columbia Democratic presidential primary". The Washington Post. June 17, 2020. Retrieved April 15, 2022.
- ^ "District of Columbia Democratic Delegation 2020". The Green Papers. June 14, 2019. Retrieved June 23, 2019.
- ^ "2020 POTUS Race ratings" (PDF). The Cook Political Report. Retrieved May 21, 2019.
- ^ "POTUS Ratings | Inside Elections". insideelections.com. Retrieved May 21, 2019.
- ^ "Larry J. Sabato's Crystal Ball » 2020 President". crystalball.centerforpolitics.org. Retrieved May 21, 2019.
- ^ "2020 Election Forecast". Politico. November 19, 2019.
- ^ "Battle for White House". RCP. April 19, 2019.
- ^ 2020 Bitecofer Model Electoral College Predictions Archived April 23, 2020, at the Wayback Machine, Niskanen Center, March 24, 2020, retrieved: April 19, 2020.
- ^ Chalian, David; Burlij, Terence (June 11, 2020). "Road to 270: CNN's debut Electoral College map for 2020". CNN. Retrieved June 16, 2020.
- ^ "Forecasting the US elections". The Economist. Retrieved July 7, 2020.
- ^ "2020 Election Battleground Tracker". CBS News. July 12, 2020. Retrieved July 13, 2020.
- ^ "2020 Presidential Election Interactive Map". 270 to Win.
- ^ "ABC News Race Ratings". CBS News. July 24, 2020. Retrieved July 24, 2020.
- ^ "2020 Electoral Map Ratings: Trump Slides, Biden Advantage Expands Over 270 Votes". NPR.org. Retrieved August 3, 2020.
- ^ "Biden dominates the electoral map, but here's how the race could tighten". NBC News. August 6, 2020. Retrieved August 6, 2020.
- ^ "2020 Election Forecast". FiveThirtyEight. August 12, 2020. Retrieved August 14, 2020.
- ^ "General Election 2020 - Certified Results". D.C. Board of Elections.
- ^ "District of Columbia presidential election results 2020: Live results and polls". NBC News.
Further reading edit
- Summary: State Laws on Presidential Electors (PDF), Washington, D.C.: National Association of Secretaries of State, August 2020,
DC
External links edit
- Government Documents Round Table of the American Library Association, "District of Columbia (D.C.)", Voting & Elections Toolkits
- "District of Columbia: Election Tools, Deadlines, Dates, Rules, and Links", Vote.org, Oakland, CA
- "League of Women Voters of the District of Columbia". (Affiliate of the U.S. League of Women Voters)
- Washington, D.C. at Ballotpedia
- "State Elections Legislation Database", Ncsl.org, Washington, D.C.: National Conference of State Legislatures,
State legislation related to the administration of elections introduced in 2011 through this year, 2020