


Summary
Mid Dorset and North Poole is a constituency[n 1] represented in the House of Commons of the UK Parliament since 2015 by Michael Tomlinson, a Conservative.[n 2]
| Mid Dorset and North Poole | |
|---|---|
| County constituency for the House of Commons | |
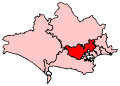 Boundary of Mid Dorset and North Poole in Dorset | |
 Location of Dorset within England | |
| County | Dorset |
| Electorate | 64,705 (December 2010)[1] |
| Major settlements | Merley, Broadstone, Corfe Mullen, Bere Regis, Wareham, and Wimborne Minster |
| Current constituency | |
| Created | 1997 |
| Member of Parliament | Michael Tomlinson (Conservative) |
| Seats | One |
Boundaries edit

1997–2010: The District of Purbeck wards of Bere Regis, Lytchett Matravers, Lytchett Minster, St Martin, and Wareham, the District of East Dorset wards of Corfe Mullen Central, Corfe Mullen North, and Corfe Mullen South, and the Borough of Poole wards of Alderney, Broadstone, Canford Heath, Canford Magna, and Creekmoor.
2010–present: The District of Purbeck wards of Bere Regis, Lytchett Matravers, Lytchett Minster and Upton East, Lytchett Minster and Upton West, St Martin, and Wareham, the District of East Dorset wards of Colehill East, Colehill West, Corfe Mullen Central, Corfe Mullen North, Corfe Mullen South, and Wimborne Minster, and the Borough of Poole wards of Broadstone, Canford Heath East, Canford Heath West, and Merley and Bearwood.
The constituency was created in 1997 from parts of the seats of North Dorset (Corfe Mullen Central, Corfe Mullen North, Corfe Mullen South, Lytchett Matravers, and Lytchett Minster wards), Poole (Broadstone, Canford Heath, Canford Magna, and Creekmoor wards), South Dorset (Bere Regis, St Martin, and Wareham wards), and Bournemouth West (Alderney ward). In 2010, Colehill and Wimborne Minster were added to the seat from North Dorset, Alderney was moved back to Bournemouth West, and Creekmoor back to Poole.
Proposed edit
Further to the 2023 Periodic Review of Westminster constituencies, enacted by the Parliamentary Constituencies Order 2023, from the next general election, due by January 2025, the constituency will be composed of the following (as they existed on 1 December 2020):
- The District of Bournemouth, Christchurch and Poole wards of: Bearwood & Merley; Broadstone; Canford Heath.
- The District of Dorset wards of: Colehill & Wimborne Minster East; Corfe Mullen; Lytchett Matravers & Upton; Stour & Allen Vale; Wareham; West Purbeck (polling districts WPU2 and WPU3); Wimborne Minster.[2]
Boundaries expanded following re-organisation of local authorities and wards in Dorset, bring the electorate within the permitted range.
Constituency profile edit
This area includes the north of the Purbeck Hills Area of Outstanding Natural Beauty and two tourist towns, namely Wimborne Minster and Wareham, the latter at one end of Poole Harbour. Income levels are close to the national average, taking into account the high proportion of pensioners living across the area.[3] and levels of rented[4] and social housing[3] are below the national average, particularly levels seen in cities.
Members of Parliament edit
| Election | Member[5] | Party | |
|---|---|---|---|
| 1997 | Christopher Fraser | Conservative | |
| 2001 | Annette Brooke | Liberal Democrat | |
| 2015 | Michael Tomlinson | Conservative | |
Elections edit
Elections in the 2020s edit
| Party | Candidate | Votes | % | ±% | |
|---|---|---|---|---|---|
| SDP | John Dowling[6] | ||||
| Green | Ben Pantling[7] | ||||
| Reform UK | Graham Sanger[8] | ||||
| Liberal Democrats | Vikki Slade[9] | ||||
Elections in the 2010s edit
| Party | Candidate | Votes | % | ±% | |
|---|---|---|---|---|---|
| Conservative | Michael Tomlinson | 29,548 | 60.4 | +1.2 | |
| Liberal Democrats | Vikki Slade | 14,650 | 29.9 | +2.4 | |
| Labour | Joanne Oldale | 3,402 | 7.0 | -6.3 | |
| Green | Natalie Carswell | 1,330 | 2.7 | New | |
| Majority | 14,898 | 30.5 | -1.2 | ||
| Turnout | 48,930 | 74.8 | +0.6 | ||
| Conservative hold | Swing | +0.7 | |||
| Party | Candidate | Votes | % | ±% | |
|---|---|---|---|---|---|
| Conservative | Michael Tomlinson | 28,585 | 59.2 | +8.4 | |
| Liberal Democrats | Vikki Slade | 13,246 | 27.5 | −0.7 | |
| Labour | Steve Brew | 6,423 | 13.3 | +7.3 | |
| Majority | 15,339 | 31.7 | +9.1 | ||
| Turnout | 48,254 | 74.2 | +1.7 | ||
| Conservative hold | Swing | +4.5 | |||
| Party | Candidate | Votes | % | ±% | |
|---|---|---|---|---|---|
| Conservative | Michael Tomlinson | 23,639 | 50.8 | +6.3 | |
| Liberal Democrats | Vikki Slade | 13,109 | 28.2 | −16.9 | |
| UKIP | Richard Turner | 5,663 | 12.2 | +7.7 | |
| Labour | Patrick Canavan | 2,767 | 6.0 | +0.1 | |
| Green | Mark Chivers | 1,321 | 2.8 | New | |
| Majority | 10,530 | 22.6 | N/A | ||
| Turnout | 46,499 | 72.5 | +8.1 | ||
| Conservative gain from Liberal Democrats | Swing | +11.6 | |||
| Party | Candidate | Votes | % | ±% | |
|---|---|---|---|---|---|
| Liberal Democrats | Annette Brooke | 21,100 | 45.1 | −4.9 | |
| Conservative | Nick King[14] | 20,831 | 44.5 | +7.7 | |
| Labour | Darren Brown | 2,748 | 5.9 | −4.2 | |
| UKIP | Dave Evans | 2,109 | 4.5 | +1.4 | |
| Majority | 269 | 0.6 | −11.5 | ||
| Turnout | 46,788 | 64.4 | −4.1 | ||
| Liberal Democrats hold | Swing | −6.3 | |||
Elections in the 2000s edit
| Party | Candidate | Votes | % | ±% | |
|---|---|---|---|---|---|
| Liberal Democrats | Annette Brooke | 22,000 | 48.7 | +6.7 | |
| Conservative | Simon Hayes | 16,518 | 36.6 | −4.5 | |
| Labour | Philip Murray | 5,221 | 11.6 | −3.9 | |
| UKIP | Avril King | 1,420 | 3.1 | +1.7 | |
| Majority | 5,482 | 12.1 | +11.2 | ||
| Turnout | 45,159 | 68.5 | +2.9 | ||
| Liberal Democrats hold | Swing | +5.6 | |||
| Party | Candidate | Votes | % | ±% | |
|---|---|---|---|---|---|
| Liberal Democrats | Annette Brooke | 18,358 | 42.0 | +2.7 | |
| Conservative | Christopher Fraser | 17,974 | 41.1 | +0.4 | |
| Labour | James Selby-Bennett | 6,765 | 15.5 | −0.3 | |
| UKIP | Jeff Mager | 621 | 1.4 | New | |
| Majority | 384 | 0.9 | N/A | ||
| Turnout | 43,718 | 65.6 | −9.9 | ||
| Liberal Democrats gain from Conservative | Swing | +1.15 | |||
Elections in the 1990s edit
| Party | Candidate | Votes | % | ±% | |
|---|---|---|---|---|---|
| Conservative | Christopher Fraser | 20,632 | 40.7 | ||
| Liberal Democrats | Alan Leaman | 19,951 | 39.3 | ||
| Labour | David Collis | 8,014 | 15.8 | ||
| Referendum | David Nabarro | 2,136 | 4.2 | ||
| Majority | 681 | 1.4 | |||
| Turnout | 50,733 | 75.7 | |||
| Conservative win (new seat) | |||||
See also edit
Notes edit
- ^ A county constituency (for the purposes of election expenses and type of returning officer)
- ^ As with all constituencies, the constituency elects one Member of Parliament (MP) by the first past the post system of election at least every five years.
References edit
- ^ "Electorate Figures - Boundary Commission for England". 2011 Electorate Figures. Boundary Commission for England. 4 March 2011. Archived from the original on 6 November 2010. Retrieved 13 March 2011.
- ^ "The Parliamentary Constituencies Order 2023". Schedule 1 Part 7 South West region.
- ^ a b "Local statistics". Office for National Statistics.
- ^ "2011 census interactive maps". Archived from the original on 29 January 2016.
- ^ Leigh Rayment's Historical List of MPs – Constituencies beginning with "D" (part 2)
- ^ "General election candidates".
- ^ "Stand at the next general election".
- ^ "Mid Dorset and North Poole constituency".
- ^ Pack, Mark (2 September 2022). "Vikki Slade selected for Mid Dorset and North Poole". markpack.org.uk. Retrieved 2 September 2022.
- ^ "Statement of Persons Nominated" (PDF).
- ^ "General election 8 June 2017". Dorsetforyou.com. Retrieved 13 May 2017.
- ^ "Election Data 2015". Electoral Calculus. Archived from the original on 17 October 2015. Retrieved 17 October 2015.
- ^ "Election Data 2010". Electoral Calculus. Archived from the original on 26 July 2013. Retrieved 17 October 2015.
- ^ "Mid Dorset and North Poole Conservatives". Conservative candidate. Mid Dorset and North Poole. 7 September 2011. Retrieved 4 July 2012.
- ^ "Election Data 2005". Electoral Calculus. Archived from the original on 15 October 2011. Retrieved 18 October 2015.
- ^ "Election Data 2001". Electoral Calculus. Archived from the original on 15 October 2011. Retrieved 18 October 2015.
- ^ "Election Data 1997". Electoral Calculus. Archived from the original on 15 October 2011. Retrieved 18 October 2015.
50°42′01″N 2°04′09″W / 50.7004°N 2.0693°W