


Summary
Torfaen is a constituency[n 1] in Wales represented in the House of Commons of the UK Parliament since 2015 by Nick Thomas-Symonds, a member of the Labour Party who also serves as the Shadow Secretary of State for International Trade.[n 2] It was established for the 1983 general election.
| Torfaen | |
|---|---|
| County constituency for the House of Commons | |
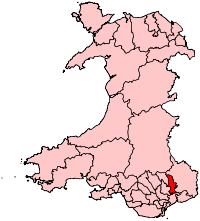 Boundary of Torfaen in Wales | |
| Preserved county | Gwent |
| Electorate | 61,806 (December 2010)[1] |
| Major settlements | Cwmbran, Pontypool, Blaenavon |
| Current constituency | |
| Created | 1983 |
| Member of Parliament | Nick Thomas-Symonds (Labour) |
| Seats | One |
| Created from | Pontypool |
| Overlaps | |
| Senedd | Torfaen, South Wales East |
The constituency is to retain its name and gain wards, as part of the 2023 Periodic Review of Westminster constituencies and under the June 2023 final recommendations of the Boundary Commission for Wales for the next United Kingdom general election.[2]
Boundaries edit

The area is traditionally a Labour Party stronghold with a majority of around 9,000. The community of New Inn is the only strong Conservative area. It voted Labour even amidst the huge Conservative majorities of 1983 and 1987. However, 2019 saw the lowest Labour majority in Torfaen in the seat's history, of only 3,742 votes, perhaps due to the constituency registering a strong Leave vote in the 2016 EU membership referendum. The area covers the new town of Cwmbran, Pontypool, and its surrounding districts and stretches as far north as Blaenavon.
Members of Parliament edit
| Election | Member[3] | Party | |
|---|---|---|---|
| 1983 | Leo Abse | Labour | |
| 1987 | Paul Murphy | Labour | |
| 2015 | Nick Thomas-Symonds | Labour | |
Elections edit
Elections in the 1980s edit
| Party | Candidate | Votes | % | ±% | |
|---|---|---|---|---|---|
| Labour | Leo Abse | 20,678 | 47.3 | N/A | |
| Liberal | Graham Blackburn | 12,393 | 28.3 | N/A | |
| Conservative | Peter Martin | 9,751 | 22.3 | N/A | |
| Plaid Cymru | Phyllis Cox | 896 | 2.1 | N/A | |
| Majority | 8,285 | 19.0 | N/A | ||
| Turnout | 43,718 | 74.4 | N/A | ||
| Registered electors | 58,739 | ||||
| Labour win (new seat) | |||||
| Party | Candidate | Votes | % | ±% | |
|---|---|---|---|---|---|
| Labour | Paul Murphy | 26,577 | 58.7 | +11.4 | |
| Liberal | Graham Blackburn | 9,027 | 19.9 | ―8.4 | |
| Conservative | Robert Gordon | 8,632 | 19.1 | ―3.2 | |
| Plaid Cymru | Jill Evans | 577 | 1.2 | ―0.9 | |
| Green | Melvin John Witherden | 450 | 1.0 | N/A | |
| Majority | 17,550 | 38.8 | +19.8 | ||
| Turnout | 45,263 | 75.6 | +1.2 | ||
| Registered electors | 59,896 | ||||
| Labour hold | Swing | +9.9 | |||
Elections in the 1990s edit
| Party | Candidate | Votes | % | ±% | |
|---|---|---|---|---|---|
| Labour | Paul Murphy | 30,352 | 64.1 | +5.4 | |
| Conservative | Mark Watkins | 9,598 | 20.3 | +1.2 | |
| Liberal Democrats | Malcolm Hewson | 6,178 | 13.1 | ―6.8 | |
| Plaid Cymru (Green) | John Cox | 1,210 | 2.6 | +1.4 | |
| Majority | 20,754 | 43.8 | +5.0 | ||
| Turnout | 47,338 | 77.5 | +1.9 | ||
| Registered electors | 61,104 | ||||
| Labour hold | Swing | +2.1 | |||
| Party | Candidate | Votes | % | ±% | |
|---|---|---|---|---|---|
| Labour | Paul Murphy | 29,863 | 69.1 | +5.0 | |
| Conservative | Neil Parish | 5,327 | 12.3 | ―8.0 | |
| Liberal Democrats | Jean Gray | 5,249 | 12.1 | ―1.0 | |
| Referendum | Deborah Holler | 1,245 | 2.9 | N/A | |
| Plaid Cymru | Robert Gough | 1,042 | 2.4 | ―0.2 | |
| Green | Roger Coghill | 519 | 1.2 | N/A | |
| Majority | 24,536 | 56.8 | +13.0 | ||
| Turnout | 43,245 | 71.7 | ―5.8 | ||
| Registered electors | 60,343 | ||||
| Labour hold | Swing | +6.5 | |||
Elections in the 2000s edit
| Party | Candidate | Votes | % | ±% | |
|---|---|---|---|---|---|
| Labour | Paul Murphy | 21,883 | 62.1 | ―7.0 | |
| Conservative | Jason Evans | 5,603 | 15.9 | +3.6 | |
| Liberal Democrats | Alan Masters | 3,936 | 11.2 | ―0.9 | |
| Plaid Cymru | Stephen Smith | 2,720 | 7.7 | +5.3 | |
| UKIP | Brenda Vipass | 657 | 1.9 | N/A | |
| Socialist Alliance | Stephen Bell | 443 | 1.3 | N/A | |
| Majority | 16,280 | 46.2 | -10.4 | ||
| Turnout | 35,242 | 57.7 | ―14.0 | ||
| Registered electors | 61,115 | ||||
| Labour hold | Swing | ―5.3 | |||
| Party | Candidate | Votes | % | ±% | |
|---|---|---|---|---|---|
| Labour | Paul Murphy | 20,472 | 56.9 | ―5.2 | |
| Conservative | Nick Ramsay | 5,681 | 15.8 | ―0.1 | |
| Liberal Democrats | Veronica Watkins | 5,678 | 15.8 | +4.6 | |
| Plaid Cymru | Aneurin Preece | 2,242 | 6.2 | ―1.5 | |
| UKIP | David Rowlands | 1,145 | 3.2 | +1.3 | |
| Independent | Richard Turner-Thomas | 761 | 2.1 | N/A | |
| Majority | 14,791 | 41.1 | ―5.1 | ||
| Turnout | 35,979 | 59.3 | +1.6 | ||
| Registered electors | 60,665 | ||||
| Labour hold | Swing | ―2.5 | |||
Elections in the 2010s edit
| Party | Candidate | Votes | % | ±% | |
|---|---|---|---|---|---|
| Labour | Paul Murphy | 16,847 | 44.8 | ―12.1 | |
| Conservative | Jonathan H. Burns | 7,541 | 20.0 | +4.2 | |
| Liberal Democrats | David P. Morgan | 6,264 | 16.6 | +0.8 | |
| Plaid Cymru | Rhys G. ab Elis | 2,005 | 5.3 | ―0.9 | |
| BNP | Jennifer Noble | 1,657 | 4.4 | N/A | |
| Independent | Fred Wildgust | 1,419 | 3.8 | N/A | |
| UKIP | Gareth Dunn | 862 | 2.3 | ―0.9 | |
| Independent | Richard Turner-Thomas | 607 | 1.6 | ―0.5 | |
| Green | Owen Clarke | 438 | 1.2 | N/A | |
| Rejected ballots | 46 | ||||
| Majority | 9,306 | 24.8 | ―16.3 | ||
| Turnout | 37,640 | 61.5 | +2.2 | ||
| Registered electors | 61,183 | ||||
| Labour hold | Swing | ―8.2 | |||
Of the 46 rejected ballots:
- 26 were either unmarked or it was uncertain who the vote was for.[17]
- 19 voted for more than one candidate.[17]
- 1 had writing or mark by which the voter could be identified.[17]
| Party | Candidate | Votes | % | ±% | |
|---|---|---|---|---|---|
| Labour | Nick Thomas-Symonds | 16,938 | 44.6 | ―0.2 | |
| Conservative | Graham Smith | 8,769 | 23.1 | +3.1 | |
| UKIP | Ken Beswick | 7,203 | 19.0 | +16.7 | |
| Plaid Cymru | Boydd Hackley-Green | 2,169 | 5.7 | +0.4 | |
| Liberal Democrats | Alison Willott | 1,271 | 3.4 | ―13.2 | |
| Green | Matt Cooke[21] | 746 | 2.0 | +0.8 | |
| Socialist Labour | John Cox | 697 | 1.8 | N/A | |
| Communist | Mark Griffiths | 144 | 0.4 | N/A | |
| Rejected ballots | 68 | ||||
| Majority | 8,169 | 21.5 | ―3.3 | ||
| Turnout | 37,937 | 61.3 | ―0.2 | ||
| Registered electors | 61,896 | ||||
| Labour hold | Swing | ―1.6 | |||
Of the 68 rejected ballots:
- 47 were either unmarked or it was uncertain who the vote was for.[19]
- 21 voted for more than one candidate.[19]
| Party | Candidate | Votes | % | ±% | |
|---|---|---|---|---|---|
| Labour | Nick Thomas-Symonds | 22,134 | 57.6 | +13.0 | |
| Conservative | Graham Smith | 11,894 | 31.0 | +7.9 | |
| Plaid Cymru | Jeff Rees | 2,059 | 5.4 | ―0.3 | |
| UKIP | Ian Williams | 1,490 | 3.9 | ―15.1 | |
| Liberal Democrats | Andrew Best | 852 | 2.2 | ―1.2 | |
| Rejected ballots | 62 | ||||
| Majority | 10,240 | 26.6 | +5.1 | ||
| Turnout | 38,494 | 62.2 | +0.9 | ||
| Registered electors | 61,839 | ||||
| Labour hold | Swing | +2.5 | |||
Of the 62 rejected ballots:
- 39 were either unmarked or it was uncertain who the vote was for.[24]
- 23 voted for more than one candidate.[24]
| Party | Candidate | Votes | % | ±% | |
|---|---|---|---|---|---|
| Labour | Nick Thomas-Symonds | 15,546 | 41.8 | ―15.8 | |
| Conservative | Graham Smith | 11,804 | 31.8 | +0.8 | |
| Brexit Party | David Thomas | 5,742 | 15.4 | N/A | |
| Liberal Democrats | John Miller | 1,831 | 4.9 | +2.7 | |
| Plaid Cymru | Morgan Bowler-Brown | 1,441 | 3.9 | ―1.5 | |
| Green | Andrew Heygate-Browne | 812 | 2.2 | N/A | |
| Rejected ballots | 126 | ||||
| Majority | 3,742 | 10.0 | ―16.6 | ||
| Turnout | 37,176 | 60.2 | ―2.0 | ||
| Registered electors | 61,743 | ||||
| Labour hold | Swing | ―8.3 | |||
Of the 126 rejected ballots:
- 100 were either unmarked or it was uncertain who the vote was for.[27]
- 26 voted for more than one candidate.[27]
Elections in the 2020s edit
| Party | Candidate | Votes | % | ±% | |
|---|---|---|---|---|---|
| Labour | Nick Thomas-Symonds[28] | ||||
| Conservative | Nathan Edmunds[29] | ||||
| Plaid Cymru | Matthew Jones[30] | ||||
| Reform UK | Ian Williams[31] | ||||
| Rejected ballots | |||||
| Majority | |||||
| Turnout | |||||
| Registered electors | |||||
| Swing | |||||
See also edit
Notes edit
- ^ A county constituency (for the purposes of election expenses and type of returning officer)
- ^ As with all constituencies, the constituency elects one Member of Parliament (MP) by the first past the post system of election at least every five years.
References edit
- ^ "Beyond 20/20 WDS - Table view". 2011 Electorate Figures. StatsWales. 1 December 2010. Retrieved 13 March 2011.
- ^ 2023 Review of Parliamentary Constituencies - The 2023 Review of Parliamentary Constituencies in Wales (PDF). Boundary Commission for Wales. 28 June 2023.
- ^ Leigh Rayment's Historical List of MPs – Constituencies beginning with "T" (part 2)
- ^ "Election Data 1983". Electoral Calculus. Archived from the original on 15 October 2011. Retrieved 18 October 2015.
- ^ "Election Data 1987". Electoral Calculus. Archived from the original on 15 October 2011. Retrieved 18 October 2015.
- ^ "Election Data 1992". Electoral Calculus. Archived from the original on 15 October 2011. Retrieved 18 October 2015.
- ^ "Politics Resources". Election 1992. Politics Resources. 9 April 1992. Retrieved 6 December 2010.
- ^ "Election Data 1997". Electoral Calculus. Archived from the original on 15 October 2011. Retrieved 18 October 2015.
- ^ "BBC NEWS>VOTE 2001>Results and Constituencies>Torfaen". Vote 2001. BBC News. 1 May 1997. Retrieved 11 April 2020.
- ^ "Election Data 2001". Electoral Calculus. Archived from the original on 15 October 2011. Retrieved 18 October 2015.
- ^ "BBC NEWS >Torfaen". Vote 2001. BBC News. 7 June 2001. Retrieved 11 April 2020.
- ^ "Election Data 2005". Electoral Calculus. Archived from the original on 15 October 2011. Retrieved 18 October 2015.
- ^ "Torfaen parliamentary constituency - Election 2005" – via www.bbc.co.uk.
- ^ "2005 Results" (PDF). Torfaen County Borough Council. Torfaen County Borough Council. Retrieved 11 April 2020.
- ^ "Election Data 2010". Electoral Calculus. Archived from the original on 26 July 2013. Retrieved 17 October 2015.
- ^ BBC News Election Coverage - Torfaen
- ^ a b c d "Results" (PDF). Torfaen County Borough Council. Torfaen County Borough Council. Retrieved 11 April 2020.
- ^ "Election Data 2015". Electoral Calculus. Archived from the original on 17 October 2015. Retrieved 17 October 2015.
- ^ a b c "May 2015 Election Result" (PDF). Declaration of the result of the poll. Torfaen County Borough Council. Retrieved 15 September 2015.
- ^ "Torfaen Parliamentary constituency". Election 2015 Results. BBC. Retrieved 11 April 2020.
- ^ "Greens announce candidate for Torfaen". South Wales Argus.
- ^ "Statement of Persons Nominated and Notice of Poll" (PDF). Torfaen County Borough Council. 18 June 2017.
- ^ "Torfaen Parliamentary constituency". Election 2017 Results. BBC. Retrieved 11 April 2020.
- ^ a b c "2017 Results" (PDF). Torfaen County Borough Council. Torfaen County Borough Council. Retrieved 11 April 2020.
- ^ "Statement of Persons Nominated and Notice of Poll" (PDF). Torfaen County Borough Council. 14 November 2019. Archived (PDF) from the original on 14 November 2019. Retrieved 14 November 2019.
- ^ "Torfaen Parliamentary constituency". Election 2019 Results. BBC. Retrieved 11 April 2020.
- ^ a b c "Election-Results/General-Election-2019" (PDF). Torfaen County Borough Council. Torfaen County Borough Council. Retrieved 11 April 2020.
- ^ https://twitter.com/NickTorfaen/status/1596219629898432512
- ^ https://www.southwalesargus.co.uk/news/23796074.conservatives-announce-torfaen-general-election-candidate/
- ^ https://www.cwmbranlife.co.uk/plaid-cymru-announce-general-election-candidate
- ^ https://www.reformparty.uk/find_my_ppc
External links edit
- Politics Resources (Election results from 1922 onwards)
- Electoral Calculus (Election results from 1955 onwards)
- 2017 Election House Of Commons Library 2017 Election report
- A Vision Of Britain Through Time (Constituency elector numbers)
51°41′46″N 3°03′47″W / 51.696°N 3.063°W