


Summary
The 1964 United States presidential election in Pennsylvania took place on November 3, 1964, and was part of the 1964 United States presidential election. Voters chose 29 representatives to the Electoral College, who voted for president and vice president. Pennsylvania overwhelmingly voted for the Democratic nominee, President Lyndon B. Johnson, over the Republican nominee, Senator Barry Goldwater. Johnson won Pennsylvania by a margin of 30.22%. Apart from William Howard Taft in 1912 (when third-party candidates obtained substantial minorities of the vote), Goldwater's 34.7% of the vote is easily the worst showing for a Republican in the state since the party was founded.[1] Even relative to Johnson's popular vote landslide, Pennsylvania came out as 7.64% more Democratic than the nation at-large; the only occasion under the current two-party system that the state has been more anomalously Democratic than this was in Ronald Reagan's 1984 landslide.[1]
| ||||||||||||||||||||||||||
| ||||||||||||||||||||||||||
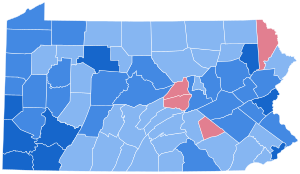 County Results
| ||||||||||||||||||||||||||
| ||||||||||||||||||||||||||

During the 1960s the Republican Party was turning its attention from the declining rural Yankee counties to the growing and traditionally Democratic Catholic vote,[2] along with the conservative Sun Belt whose growth was driven by lower taxes, warm weather, and air conditioning. This growth meant that activist Republicans centered in the Sun Belt had become much more conservative than the majority of members in historic Northeastern GOP strongholds.[3]
The consequence of this was that a bitterly divided Republican Party was able to nominate the staunchly conservative Senator Barry Goldwater of Arizona, who ran with the equally conservative Republican National Committee chair, Congressman William E. Miller of New York, for President in 1964. Goldwater was widely seen in the liberal Northeastern United States as a right-wing extremist or at least an inexperienced nominee prone to gaffes;[4] he had voted against the Civil Rights Act of 1964, and the Johnson campaign portrayed him as liable to provoke a nuclear war.[5] Goldwater wrote Pennsylvania off from the very beginning of his campaign.[6] Pennsylvania Republicans had generally preferred moderate Governor William Scranton for the nomination, who was unsuccessfully encouraged to run by Dwight D. Eisenhower.[7] Many Pennsylvania Republicans, such as Representative James G. Fulton, refused to endorse Goldwater.[8]
Results edit
| 1964 United States presidential election in Pennsylvania[9] | |||||
|---|---|---|---|---|---|
| Party | Candidate | Votes | Percentage | Electoral votes | |
| Democratic | Lyndon B. Johnson (incumbent) | 3,130,954 | 64.92% | 29 | |
| Republican | Barry Goldwater | 1,673,657 | 34.70% | 0 | |
| Militant Workers | Clifton DeBerry | 10,456 | 0.22% | 0 | |
| Socialist Labor | Eric Hass | 5,092 | 0.11% | 0 | |
| Write-ins | Write-ins | 2,531 | 0.05% | 0 | |
| Totals | 4,822,690 | 100.00% | 29 | ||
| Voter Turnout (Voting age/Registered) | 68%/84% | ||||
Results by county edit
| 1964 United States presidential election in Pennsylvania by county | |||||||||
|---|---|---|---|---|---|---|---|---|---|
| County | Lyndon Baines Johnson Democratic |
Barry Morris Goldwater Republican |
Various candidates Other parties |
Margin | Total votes cast | ||||
| # | % | # | % | # | % | # | % | ||
| Adams | 11,148 | 56.13% | 8,617 | 43.39% | 95 | 0.48% | 2,531 | 12.74% | 19,860 |
| Allegheny | 475,207 | 66.03% | 241,707 | 33.58% | 2,811 | 0.39% | 233,500 | 32.44% | 719,725 |
| Armstrong | 21,098 | 66.37% | 10,618 | 33.40% | 74 | 0.23% | 10,480 | 32.97% | 31,790 |
| Beaver | 60,492 | 72.02% | 23,174 | 27.59% | 327 | 0.39% | 37,318 | 44.43% | 83,993 |
| Bedford | 9,165 | 53.45% | 7,968 | 46.47% | 14 | 0.08% | 1,197 | 6.98% | 17,147 |
| Berks | 73,444 | 66.38% | 36,726 | 33.19% | 476 | 0.43% | 36,718 | 33.19% | 110,646 |
| Blair | 26,157 | 51.76% | 24,301 | 48.09% | 73 | 0.14% | 1,856 | 3.67% | 50,531 |
| Bradford | 10,714 | 50.63% | 10,434 | 49.31% | 14 | 0.07% | 280 | 1.32% | 21,162 |
| Bucks | 78,287 | 60.60% | 50,243 | 38.89% | 646 | 0.50% | 28,044 | 21.71% | 129,176 |
| Butler | 27,267 | 60.97% | 17,360 | 38.82% | 95 | 0.21% | 9,907 | 22.15% | 44,722 |
| Cambria | 55,183 | 67.63% | 26,281 | 32.21% | 134 | 0.16% | 28,902 | 35.42% | 81,598 |
| Cameron | 1,904 | 57.96% | 1,376 | 41.89% | 5 | 0.15% | 528 | 16.07% | 3,285 |
| Carbon | 15,416 | 67.49% | 7,309 | 32.00% | 116 | 0.51% | 8,107 | 35.49% | 22,841 |
| Centre | 16,556 | 63.20% | 9,481 | 36.19% | 158 | 0.60% | 7,075 | 27.01% | 26,195 |
| Chester | 47,940 | 54.10% | 40,280 | 45.46% | 390 | 0.44% | 7,660 | 8.64% | 88,610 |
| Clarion | 9,235 | 60.01% | 6,143 | 39.92% | 11 | 0.07% | 3,092 | 20.09% | 15,389 |
| Clearfield | 19,211 | 62.67% | 11,338 | 36.99% | 103 | 0.34% | 7,873 | 25.69% | 30,652 |
| Clinton | 10,038 | 69.84% | 4,298 | 29.91% | 36 | 0.25% | 5,740 | 39.94% | 14,372 |
| Columbia | 13,885 | 60.63% | 8,982 | 39.22% | 36 | 0.16% | 4,903 | 21.41% | 22,903 |
| Crawford | 18,212 | 62.82% | 10,664 | 36.78% | 115 | 0.40% | 7,548 | 26.04% | 28,991 |
| Cumberland | 26,633 | 52.71% | 23,685 | 46.88% | 207 | 0.41% | 2,948 | 5.83% | 50,525 |
| Dauphin | 46,119 | 51.57% | 42,718 | 47.77% | 594 | 0.66% | 3,401 | 3.80% | 89,431 |
| Delaware | 147,189 | 56.81% | 111,189 | 42.91% | 717 | 0.28% | 36,000 | 13.89% | 259,095 |
| Elk | 10,455 | 70.51% | 4,354 | 29.36% | 19 | 0.13% | 6,101 | 41.15% | 14,828 |
| Erie | 72,944 | 69.55% | 31,393 | 29.93% | 549 | 0.52% | 41,551 | 39.62% | 104,886 |
| Fayette | 45,155 | 73.35% | 16,127 | 26.20% | 276 | 0.45% | 29,028 | 47.16% | 61,558 |
| Forest | 1,249 | 57.99% | 900 | 41.78% | 5 | 0.23% | 349 | 16.20% | 2,154 |
| Franklin | 19,332 | 58.68% | 13,525 | 41.06% | 85 | 0.26% | 5,807 | 17.63% | 32,942 |
| Fulton | 2,180 | 55.37% | 1,747 | 44.37% | 10 | 0.25% | 433 | 11.00% | 3,937 |
| Greene | 11,412 | 74.46% | 3,896 | 25.42% | 19 | 0.12% | 7,516 | 49.04% | 15,327 |
| Huntingdon | 7,435 | 52.96% | 6,571 | 46.81% | 33 | 0.24% | 864 | 6.15% | 14,039 |
| Indiana | 17,568 | 59.92% | 11,706 | 39.92% | 46 | 0.16% | 5,862 | 19.99% | 29,320 |
| Jefferson | 10,851 | 56.34% | 8,373 | 43.47% | 37 | 0.19% | 2,478 | 12.87% | 19,261 |
| Juniata | 4,138 | 57.19% | 3,087 | 42.67% | 10 | 0.14% | 1,051 | 14.53% | 7,235 |
| Lackawanna | 88,131 | 73.73% | 31,272 | 26.16% | 137 | 0.11% | 56,859 | 47.56% | 119,540 |
| Lancaster | 53,041 | 50.27% | 52,243 | 49.52% | 224 | 0.21% | 798 | 0.76% | 105,508 |
| Lawrence | 29,092 | 64.35% | 15,998 | 35.39% | 117 | 0.26% | 13,094 | 28.96% | 45,207 |
| Lebanon | 15,882 | 46.93% | 17,891 | 52.86% | 72 | 0.21% | -2,009 | -5.94% | 33,845 |
| Lehigh | 60,377 | 64.86% | 32,245 | 34.64% | 471 | 0.51% | 28,132 | 30.22% | 93,093 |
| Luzerne | 106,397 | 69.97% | 43,895 | 28.86% | 1,779 | 1.17% | 62,502 | 41.10% | 152,071 |
| Lycoming | 25,879 | 57.58% | 19,011 | 42.30% | 55 | 0.12% | 6,868 | 15.28% | 44,945 |
| McKean | 10,950 | 57.61% | 7,948 | 41.82% | 109 | 0.57% | 3,002 | 15.79% | 19,007 |
| Mercer | 32,199 | 63.68% | 18,153 | 35.90% | 211 | 0.42% | 14,046 | 27.78% | 50,563 |
| Mifflin | 8,811 | 59.31% | 6,006 | 40.43% | 39 | 0.26% | 2,805 | 18.88% | 14,856 |
| Monroe | 10,622 | 62.41% | 6,281 | 36.91% | 116 | 0.68% | 4,341 | 25.51% | 17,019 |
| Montgomery | 135,657 | 56.74% | 102,714 | 42.96% | 704 | 0.29% | 32,943 | 13.78% | 239,075 |
| Montour | 3,683 | 59.27% | 2,527 | 40.67% | 4 | 0.06% | 1,156 | 18.60% | 6,214 |
| Northampton | 58,818 | 73.08% | 21,048 | 26.15% | 619 | 0.77% | 37,770 | 46.93% | 80,485 |
| Northumberland | 28,082 | 62.07% | 17,046 | 37.68% | 116 | 0.26% | 11,036 | 24.39% | 45,244 |
| Perry | 6,054 | 52.86% | 5,364 | 46.84% | 34 | 0.30% | 690 | 6.03% | 11,452 |
| Philadelphia | 670,645 | 73.42% | 239,733 | 26.24% | 3,094 | 0.34% | 430,912 | 47.17% | 913,472 |
| Pike | 2,753 | 50.74% | 2,651 | 48.86% | 22 | 0.41% | 102 | 1.88% | 5,426 |
| Potter | 3,652 | 52.86% | 3,232 | 46.78% | 25 | 0.36% | 420 | 6.08% | 6,909 |
| Schuylkill | 50,560 | 65.63% | 26,386 | 34.25% | 96 | 0.12% | 24,174 | 31.38% | 77,042 |
| Snyder | 4,199 | 44.59% | 5,195 | 55.17% | 22 | 0.23% | -996 | -10.58% | 9,416 |
| Somerset | 17,934 | 54.65% | 14,817 | 45.15% | 63 | 0.19% | 3,117 | 9.50% | 32,814 |
| Sullivan | 1,690 | 55.63% | 1,344 | 44.24% | 4 | 0.13% | 346 | 11.39% | 3,038 |
| Susquehanna | 7,838 | 54.37% | 6,567 | 45.55% | 12 | 0.08% | 1,271 | 8.82% | 14,417 |
| Tioga | 7,415 | 51.16% | 7,064 | 48.73% | 16 | 0.11% | 351 | 2.42% | 14,495 |
| Union | 4,262 | 46.25% | 4,944 | 53.65% | 10 | 0.11% | -682 | -7.40% | 9,216 |
| Venango | 13,065 | 56.75% | 9,873 | 42.89% | 84 | 0.36% | 3,192 | 13.86% | 23,022 |
| Warren | 10,598 | 63.62% | 5,965 | 35.81% | 94 | 0.56% | 4,633 | 27.81% | 16,657 |
| Washington | 63,482 | 72.34% | 24,127 | 27.49% | 147 | 0.17% | 39,355 | 44.85% | 87,756 |
| Wayne | 5,781 | 46.89% | 6,512 | 52.82% | 35 | 0.28% | -731 | -5.93% | 12,328 |
| Westmoreland | 107,131 | 71.70% | 41,493 | 27.77% | 792 | 0.53% | 65,638 | 43.93% | 149,416 |
| Wyoming | 4,268 | 52.41% | 3,864 | 47.45% | 12 | 0.15% | 404 | 4.96% | 8,144 |
| York | 58,787 | 63.30% | 33,677 | 36.26% | 408 | 0.44% | 25,110 | 27.04% | 92,872 |
| Totals | 3,130,954 | 64.92% | 1,673,657 | 34.70% | 18,079 | 0.37% | 1,457,297 | 30.22% | 4,822,690 |
Analysis edit
Johnson won all but four counties in Pennsylvania: the central Pennsylvania counties of Snyder and Union, which have not voted Democratic since the Civil War;[10] northeastern Wayne County, which has never voted Democratic since Grover Cleveland won it in 1892; and Lebanon County, which has only once voted Democratic since 1856 (when Franklin D. Roosevelt narrowly won it in his 1936 landslide).[11] This was the last presidential election in which Philadelphia was not the most Democratic county in Pennsylvania. This is also the only occasion since 1856 when Somerset, Lancaster, and Huntingdon counties have not voted for the Republican presidential candidate, and marked the first time since that election when suburban Delaware County had not voted Republican.[12]
Six other counties including Butler, Bradford, Tioga, Potter, Cameron and McKean cast their solitary vote for a Democratic presidential candidate since at least the Civil War in this election. In addition, much of the Susquehanna Valley and Appalachia (comprising York County, Cumberland County, Franklin County, Adams County, Blair County, Lycoming County, Northumberland County, Bedford County, Clarion County, Crawford County, Fulton County, Pike County, Venango County, Mifflin County, Perry County, Jefferson County, Susquehanna County, Wyoming County, Juniata County, Montour County, and Sullivan County) has never voted for a Democratic candidate since.[10]
This was the last occasion until 2008 that the Democrats won Dauphin County, Berks County, Monroe County, or Chester County.[13]
See also edit
References edit
- ^ a b "Pennsylvania Voting Results and Participants". CountingTheVotes.com. Retrieved January 27, 2024.
- ^ Phillips, Kevin; The Emerging Republican Majority; pp. 55-60 ISBN 978-0-691-16324-6
- ^ Nexon, David; 'Asymmetry in the Political System: Occasional Activists in the Republican and Democratic Parties, 1956-1964', The American Political Science Review, vol. 65, No. 3 (Sep., 1971), pp. 716-730
- ^ Donaldson, Gary; Liberalism's Last Hurrah: The Presidential Campaign of 1964; p. 190 ISBN 1510702369
- ^ Edwards, Lee and Schlafly, Phyllis; Goldwater: The Man Who Made a Revolution; pp. 286-290 ISBN 162157458X
- ^ Kelley, Stanley junior; 'The Goldwater Strategy'; The Princeton Review; pp. 8-11
- ^ Donaldson; Liberalism's Last Hurrah, chapter 3
- ^ Donaldson; Liberalism's Last Hurrah, p. 180
- ^ Tim Murphy. "1964 Presidential General Election Results – Pennsylvania". David Leip's Atlas of US Presidential Elections. Retrieved March 25, 2018.
- ^ a b Sullivan, Robert David; ‘How the Red and Blue Map Evolved Over the Past Century’; America Magazine in The National Catholic Review; June 29, 2016
- ^ Scammon, Richard M. (compiler); America at the Polls: A Handbook of Presidential Election Statistics 1920-1964; p. 381 ISBN 0405077114
- ^ Menendez, Albert J.; The Geography of Presidential Elections in the United States, 1868-2004, pp. 287-290 ISBN 0786422173
- ^ Evie Stone. "372 Counties Flipped In '08". NPR. Retrieved May 3, 2024.