


Summary
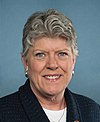
California 26th congressional district is a congressional district in the U.S. state of California currently represented by Democrat Julia Brownley.
| California's 26th congressional district | |||
|---|---|---|---|
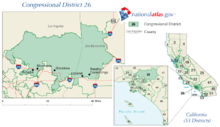
Interactive map of district boundaries since 2023 (Used in the 2022 elections) | |||
| Representative |
| ||
| Population (2022) | 758,064 | ||
| Median household income | $107,265[1] | ||
| Ethnicity |
| ||
| Cook PVI | D+8[2] | ||


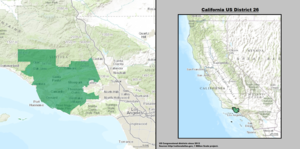
The district is located on the South Coast, comprising most of Ventura County as well as a small portion of Los Angeles County. Cities in the district include Camarillo, Oxnard, Santa Paula, Thousand Oaks, Westlake Village, Moorpark, and part of Simi Valley. In 2022, the district lost Ojai and most of Ventura and added Calabasas, Agoura Hills, and the sparsely populated northern half of Ventura County.[3]
From 2003 to 2013, the district spanned the foothills of the San Gabriel Valley from La Cañada Flintridge to Rancho Cucamonga. David Dreier, a Republican, represented the district during this period.
Recent election results from statewide races edit
| Year | Office | Results | |
|---|---|---|---|
| 1992 | President | Clinton 56.8 – 24.3% | |
| Senator | Boxer 55.4 – 35.6% | ||
| Senator | Feinstein 61.5 – 30.1% | ||
| 1994 | Governor | ||
| Senator | |||
| 1996 | President | ||
| 1998 | Governor | ||
| Senator | |||
| 2000 | President[4] | Gore 70.3 – 25.4% | |
| Senator[5] | Feinstein 69.9 – 21.7% | ||
| 2002 | Governor[6] | Simon 54.3 – 37.6% | |
| 2003 | Recall[7][8] | ||
| Schwarzenegger 61.1 – 20.3% | |||
| 2004 | President[9] | Bush 55.1 – 43.7% | |
| Senator[10] | Boxer 48.2 – 47.3% | ||
| 2006 | Governor[11] | Schwarzenegger 65.1 – 30.5% | |
| Senator[12] | Feinstein 48.0 – 47.4% | ||
| 2008 | President[13] | Obama 51.0 – 47.0% | |
| 2010 | Governor | Whitman 50.4 – 43.8% | |
| Senator | Fiorina 52.7 – 41.9% | ||
| 2012 | President | Obama 54.0 – 43.7% | |
| Senator | Feinstein 56.2 – 43.8% | ||
| 2014 | Governor | Brown 55.1 – 45.9% | |
| 2016 | President | Clinton 57.9 – 36.0% | |
| Senator | Harris 60.8 – 39.2% | ||
| 2018 | Governor | Newsom 57.3 – 42.7% | |
| Senator | Feinstein 52.1 – 47.9% | ||
| 2020 | President | Biden 61.4 – 36.5% | |
| 2021 | Recall[14] | ||
| 2022 | Governor | Newsom 53.7 – 46.3% | |
| Senator | Padilla 55.2 – 44.8% | ||
2005 special elections edit
Proposition 73 edit
Parental notification before termination of minors' pregnancy.
- 55.0% YES
- 45.0% NO
Proposition 77 edit
Redistricting according to a panel of retired judges.
- 49.8% YES
- 50.2% NO
Proposition 80 edit
Regulation of electric grids and services through California.
- 32.1% YES
- 67.9% NO
List of members representing the district edit


Election results edit
|
1952 • 1954 • 1956 • 1958 • 1960 • 1962 • 1964 • 1965 (Special) • 1966 • 1968 • 1970 • 1972 • 1974 • 1976 • 1978 • 1980 • 1982 • 1984 • 1986 • 1988 • 1990 • 1992 • 1994 • 1996 • 1998 • 2000 • 2002 • 2004 • 2006 • 2008 • 2010 • 2012 • 2014 • 2016 • 2018 • 2020 • 2022 |
1952 edit
| Party | Candidate | Votes | % | |
|---|---|---|---|---|
| Democratic | Sam Yorty (incumbent) | 157,973 | 88 | |
| Progressive | Horace V. Alexander | 21,465 | 12 | |
| Total votes | 179,438 | 100.0 | ||
| Turnout | {{{votes}}} | |||
| Democratic hold | ||||
1954 edit
| Party | Candidate | Votes | % | |
|---|---|---|---|---|
| Democratic | James Roosevelt | 94,261 | 60.1 | |
| Republican | Theodore R. "Ted" Owings | 62,585 | 39.9 | |
| Total votes | 156,856 | 100.0 | ||
| Turnout | {{{votes}}} | |||
| Democratic hold | ||||
1956 edit
| Party | Candidate | Votes | % | |
|---|---|---|---|---|
| Democratic | James Roosevelt (incumbent) | 133,036 | 68.8 | |
| Republican | Edward H. Gibbons | 60,230 | 31.2 | |
| Total votes | 193,266 | 100.0 | ||
| Turnout | {{{votes}}} | |||
| Democratic hold | ||||
1958 edit
| Party | Candidate | Votes | % | |
|---|---|---|---|---|
| Democratic | James Roosevelt (incumbent) | 125,495 | 72.2 | |
| Republican | Crispus Wright | 48,248 | 27.8 | |
| Total votes | 173,743 | 100.0 | ||
| Turnout | {{{votes}}} | |||
| Democratic hold | ||||
1960 edit
| Party | Candidate | Votes | % | |
|---|---|---|---|---|
| Democratic | James Roosevelt (incumbent) | 150,318 | 73.4 | |
| Republican | William E. McIntyre | 54,540 | 26.6 | |
| Total votes | 204,818 | 100.0 | ||
| Turnout | {{{votes}}} | |||
| Democratic hold | ||||
1962 edit
| Party | Candidate | Votes | % | |
|---|---|---|---|---|
| Democratic | James Roosevelt (incumbent) | 112,162 | 68.3 | |
| Republican | Daniel Beltz | 52,063 | 31.7 | |
| Total votes | 164,225 | 100.0 | ||
| Turnout | {{{votes}}} | |||
| Democratic hold | ||||
1964 edit
| Party | Candidate | Votes | % | |
|---|---|---|---|---|
| Democratic | James Roosevelt (incumbent) | 136,025 | 70.3 | |
| Republican | Gil Seton | 57,209 | 29.7 | |
| Total votes | 193,234 | 100.0 | ||
| Turnout | {{{votes}}} | |||
| Democratic hold | ||||
1965 (Special) edit
| Party | Candidate | Votes | % | |
|---|---|---|---|---|
| Democratic | Thomas M. Rees | 59.4 | ||
| Republican | Edward M. Marshall | 40.6 | ||
| Total votes | {{{votes}}} | 100.0 | ||
| Turnout | {{{votes}}} | |||
| Democratic hold | ||||
1966 edit
| Party | Candidate | Votes | % | |
|---|---|---|---|---|
| Democratic | Thomas M. Rees (incumbent) | 103,289 | 62.3 | |
| Republican | Irving Teichner | 62,441 | 37.7 | |
| Total votes | 165,730 | 100.0 | ||
| Turnout | {{{votes}}} | |||
| Democratic hold | ||||
1968 edit
| Party | Candidate | Votes | % | |
|---|---|---|---|---|
| Democratic | Thomas M. Rees (incumbent) | 132,447 | 65.5 | |
| Republican | Irving Teichner | 63,393 | 31.3 | |
| Peace and Freedom | Jack Weinberg | 6,394 | 3.2 | |
| Total votes | 202,234 | 100.0 | ||
| Turnout | {{{votes}}} | |||
| Democratic hold | ||||
1970 edit
| Party | Candidate | Votes | % | |
|---|---|---|---|---|
| Democratic | Thomas M. Rees (incumbent) | 130,499 | 71.3 | |
| Republican | Nathaniel Jay Friedman | 47,260 | 25.8 | |
| Peace and Freedom | Lewis B. McCammon | 3,677 | 2.0 | |
| American Independent | Howard E. Hallinan | 1,639 | 0.9 | |
| Total votes | 183,075 | 100.0 | ||
| Turnout | {{{votes}}} | |||
| Democratic hold | ||||
1972 edit
| Party | Candidate | Votes | % | |
|---|---|---|---|---|
| Democratic | Thomas M. Rees (incumbent) | 160,932 | 68.6 | |
| Republican | Philip Robert Rutta | 65,473 | 27.9 | |
| Peace and Freedom | Mike Timko | 8,094 | 3.5 | |
| Total votes | 234,499 | 100.0 | ||
| Turnout | {{{votes}}} | |||
| Democratic hold | ||||
1974 edit
| Party | Candidate | Votes | % | |
|---|---|---|---|---|
| Republican | John H. Rousselot (inc.) | 80,782 | 58.9 | |
| Democratic | Paul A. Conforti | 56,487 | 41.1 | |
| Total votes | 137,269 | 100.0 | ||
| Turnout | {{{votes}}} | |||
| Republican hold | ||||
1976 edit
| Party | Candidate | Votes | % | |
|---|---|---|---|---|
| Republican | John H. Rousselot (inc.) | 112,619 | 65.6 | |
| Democratic | Latta Bruce | 59,093 | 34.4 | |
| Total votes | 171,712 | 100.0 | ||
| Turnout | {{{votes}}} | |||
| Republican hold | ||||
1978 edit
| Party | Candidate | Votes | % | |
|---|---|---|---|---|
| Republican | John H. Rousselot (inc.) | 113,059 | 100.0 | |
| Turnout | {{{votes}}} | |||
| Republican hold | ||||
1980 edit
| Party | Candidate | Votes | % | |
|---|---|---|---|---|
| Republican | John H. Rousselot (inc.) | 116,715 | 70.9 | |
| Democratic | Joseph Louis Lisoni | 40,099 | 24.4 | |
| Libertarian | William "B. J." Wagener | 7,700 | 4.7 | |
| Total votes | 164,514 | 100.0 | ||
| Turnout | {{{votes}}} | |||
| Republican hold | ||||
1982 edit
| Party | Candidate | Votes | % | |||
|---|---|---|---|---|---|---|
| Democratic | Howard Berman | 97,383 | 59.6 | |||
| Republican | Hal Phillips | 66,072 | 40.4 | |||
| Total votes | 163,455 | 100.0 | ||||
| Turnout | {{{votes}}} | |||||
| Democratic gain from Republican | ||||||
1984 edit
| Party | Candidate | Votes | % | |
|---|---|---|---|---|
| Democratic | Howard Berman (incumbent) | 117,080 | 62.8 | |
| Republican | Miriam Ojeda | 69,372 | 37.2 | |
| Total votes | 186,452 | 100.0 | ||
| Turnout | {{{votes}}} | |||
| Democratic hold | ||||
1986 edit
| Party | Candidate | Votes | % | |
|---|---|---|---|---|
| Democratic | Howard Berman (incumbent) | 98,091 | 65.1 | |
| Republican | Robert M. Kerns | 52,662 | 34.9 | |
| Total votes | 150,753 | 100.0 | ||
| Turnout | {{{votes}}} | |||
| Democratic hold | ||||
1988 edit
| Party | Candidate | Votes | % | |
|---|---|---|---|---|
| Democratic | Howard Berman (incumbent) | 126,930 | 70.3 | |
| Republican | Gerald C. "Brodie" Broderson | 53,518 | 29.7 | |
| Total votes | 180,448 | 100.0 | ||
| Turnout | {{{votes}}} | |||
| Democratic hold | ||||
1990 edit
| Party | Candidate | Votes | % | |
|---|---|---|---|---|
| Democratic | Howard Berman (incumbent) | 78,031 | 61.1 | |
| Republican | Roy Dahlson | 44,492 | 34.8 | |
| Libertarian | Bernard Zimring | 5,268 | 4.1 | |
| Total votes | 127,791 | 100.0 | ||
| Turnout | {{{votes}}} | |||
| Democratic hold | ||||
1992 edit
| Party | Candidate | Votes | % | |
|---|---|---|---|---|
| Democratic | Howard Berman (incumbent) | 73,807 | 61.0 | |
| Republican | Gary E. Forsch | 36,453 | 30.2 | |
| Peace and Freedom | Margery Hinds | 7,180 | 5.9 | |
| Libertarian | Bernard Zimring | 3,468 | 2.9 | |
| Total votes | 120,908 | 100.0 | ||
| Turnout | {{{votes}}} | |||
| Democratic hold | ||||
1994 edit
| Party | Candidate | Votes | % | |
|---|---|---|---|---|
| Democratic | Howard Berman (incumbent) | 55,145 | 62.57 | |
| Republican | Gary E. Forsch | 28,423 | 32.25 | |
| Libertarian | Erich D. Miller | 4,570 | 5.19 | |
| Total votes | 88,138 | 100.0 | ||
| Turnout | {{{votes}}} | |||
| Democratic hold | ||||
1996 edit
| Party | Candidate | Votes | % | |
|---|---|---|---|---|
| Democratic | Howard Berman (incumbent) | 67,525 | 65.9 | |
| Republican | Bill Glass | 29,332 | 28.7 | |
| Libertarian | Scott Fritschler | 3,539 | 3.4 | |
| Natural Law | Gary Hearne | 2,119 | 2.0 | |
| Total votes | 195,545 | 100.0 | ||
| Turnout | {{{votes}}} | |||
| Democratic hold | ||||
1998 edit
| Party | Candidate | Votes | % | |
|---|---|---|---|---|
| Democratic | Howard Berman (incumbent) | 69,000 | 82.47 | |
| Libertarian | Juan Carlos Ros | 6,556 | 7.84 | |
| Green | Maria Armoudian | 4,858 | 5.81 | |
| Natural Law | David L. Cossak | 3,248 | 3.88 | |
| Total votes | 83,662 | 100.0 | ||
| Turnout | {{{votes}}} | |||
| Democratic hold | ||||
2000 edit
| Party | Candidate | Votes | % | |
|---|---|---|---|---|
| Democratic | Howard Berman (incumbent) | 96,500 | 84.1 | |
| Libertarian | Bill Farley | 13,052 | 11.4 | |
| Natural Law | David L. Cossak | 5,229 | 4.5 | |
| No party | Robert Edwards (write-in) | 5 | 0.0 | |
| Total votes | 114,786 | 100.0 | ||
| Turnout | {{{votes}}} | |||
| Democratic hold | ||||
2002 edit
| Party | Candidate | Votes | % | |
|---|---|---|---|---|
| Republican | David Dreier (incumbent) | 95,360 | 63.8 | |
| Democratic | Marjorie Musser Mikels | 50,081 | 33.5 | |
| Libertarian | Randall Weissbuch | 4,089 | 2.7 | |
| Total votes | 149,530 | 100.0 | ||
| Turnout | {{{votes}}} | |||
| Republican hold | ||||
2004 edit
| Party | Candidate | Votes | % | |
|---|---|---|---|---|
| Republican | David Dreier (incumbent) | 134,596 | 51.6 | |
| Democratic | Cynthia Matthews | 107,522 | 46.8 | |
| Libertarian | Randall Weissbuch | 9,089 | 1.6 | |
| Total votes | 251,207 | 100.0 | ||
| Turnout | {{{votes}}} | |||
| Republican hold | ||||
2006 edit
| Party | Candidate | Votes | % | |
|---|---|---|---|---|
| Republican | David Dreier (incumbent) | 102,028 | 48.29% | |
| Democratic | Cynthia Matthews | 99,878 | 47.27% | |
| Libertarian | Ted Brown | 5,887 | 2.79% | |
| American Independent | Elliott Graham | 3,503 | 1.65% | |
| Total votes | 211,296 | 100.0 | ||
| Turnout | {{{votes}}} | |||
| Republican hold | ||||
2008 edit
| Party | Candidate | Votes | % | |
|---|---|---|---|---|
| Republican | David Dreier (incumbent) | 140,615 | 52.7 | |
| Democratic | Russ Warner | 108,039 | 40.4 | |
| Libertarian | Ted Brown | 18,476 | 6.9 | |
| Total votes | 267,130 | 100.0 | ||
| Turnout | {{{votes}}} | |||
| Republican hold | ||||
2010 edit
| Party | Candidate | Votes | % | |
|---|---|---|---|---|
| Republican | David Dreier (incumbent) | 112,774 | 54.13 | |
| Democratic | Russ Warner | 76,093 | 36.52 | |
| American Independent | David L. Miller | 12,784 | 6.14 | |
| Libertarian | Randall Weissbuch | 6,696 | 3.21 | |
| Total votes | 208,347 | 100.00 | ||
| Turnout | {{{votes}}} | |||
| Republican hold | ||||
2012 edit
| Primary election | ||||
|---|---|---|---|---|
| Party | Candidate | Votes | % | |
| Republican | Tony Strickland | 49,043 | 44.1 | |
| Democratic | Julia Brownley | 29,892 | 26.9 | |
| No party preference | Linda Parks | 20,301 | 18.3 | |
| Democratic | Jess Herrera | 7,244 | 6.5 | |
| Democratic | David Cruz Thayne | 2,809 | 2.5 | |
| Democratic | Alex Maxwell Goldberg | 1,880 | 1.7 | |
| Total votes | 111,169 | 100.0 | ||
| General election | ||||
| Democratic | Julia Brownley | 139,072 | 53% | |
| Republican | Tony Strickland | 124,863 | 47% | |
| Total votes | 263,935 | 100% | ||
| Democratic gain from Republican | ||||
2014 edit
| Party | Candidate | Votes | % | |
|---|---|---|---|---|
| Democratic | Julia Brownley (incumbent) | 87,176 | 51% | |
| Republican | Jeff Gorell | 82,653 | 49% | |
| Total votes | 169,829 | 100% | ||
| Democratic hold | ||||
2016 edit
| Party | Candidate | Votes | % | |
|---|---|---|---|---|
| Democratic | Julia Brownley (incumbent) | 169,248 | 60% | |
| Republican | Rafael A. Dagnesses | 111,059 | 40% | |
| Total votes | 280,307 | 100% | ||
| Democratic hold | ||||
2018 edit
| Party | Candidate | Votes | % | |
|---|---|---|---|---|
| Democratic | Julia Brownley (incumbent) | 110,804 | 60% | |
| Republican | Antonio Sabato Jr. | 73,416 | 39% | |
| Total votes | 184,220 | 100% | ||
| Democratic hold | ||||
2020 edit
| Party | Candidate | Votes | % | |
|---|---|---|---|---|
| Democratic | Julia Brownley (incumbent) | 208,856 | 60.6 | |
| Republican | Ronda Baldwin-Kennedy | 135,877 | 39.4 | |
| Total votes | 344,733 | 100.0 | ||
2022 edit
| Party | Candidate | Votes | % | |
|---|---|---|---|---|
| Democratic | Julia Brownley (incumbent) | 134,575 | 54.5 | |
| Republican | Matt Jacobs | 112,214 | 45.5 | |
| Total votes | 246,789 | 100.0 | ||
Historical district boundaries edit

See also edit
References edit
- ^ "My Congressional District".
- ^ "2022 Cook PVI: District Map and List". Cook Political Report. Retrieved January 10, 2023.
- ^ "CA 2022 Congressional". Dave's Redistricting. January 4, 2022. Retrieved November 14, 2022.
- ^ Statement of Vote (2000 President) Archived June 11, 2007, at the Wayback Machine
- ^ Statement of Vote (2000 Senator) Archived June 11, 2007, at the Wayback Machine
- ^ Statement of Vote (2002 Governor) Archived November 11, 2010, at the Wayback Machine
- ^ Statement of Vote (2003 Recall Question) Archived May 20, 2011, at the Wayback Machine
- ^ Statement of Vote (2003 Governor) Archived May 20, 2011, at the Wayback Machine
- ^ Statement of Vote (2004 President) Archived August 1, 2010, at the Wayback Machine
- ^ Statement of Vote (2004 Senator) Archived August 10, 2011, at the Wayback Machine
- ^ Statement of Vote (2006 Governor) Archived August 10, 2011, at the Wayback Machine
- ^ Statement of Vote (2006 Senator) Archived August 10, 2011, at the Wayback Machine
- ^ (2008 President) Archived February 11, 2009, at the Wayback Machine
- ^ "Counties by Congressional District for Recall Question" (PDF). sos.ca.gov. September 14, 2021. Retrieved May 2, 2022.
- ^ Statement of Vote – 2005 Special Statewide Election Archived 2006-02-12 at the Wayback Machine
- ^ 1952 election results
- ^ 1954 election results
- ^ 1956 election results
- ^ 1958 election results
- ^ 1960 election results
- ^ 1962 election results
- ^ 1964 election results
- ^ 1965 special election results
- ^ 1966 election results
- ^ 1968 election results
- ^ 1970 election results
- ^ 1972 election results
- ^ 1974 election results
- ^ 1976 election results
- ^ 1978 election results
- ^ 1980 election results
- ^ 1982 election results
- ^ 1984 election results
- ^ 1986 election results
- ^ 1988 election results
- ^ 1990 election results
- ^ 1992 election results
- ^ 1994 election results
- ^ 1996 election results
- ^ 1998 election results
- ^ 2000 election results
- ^ 2002 general election results Archived February 3, 2009, at the Wayback Machine
- ^ 2004 general election results[permanent dead link]
- ^ 2006 general election results Archived November 27, 2008, at the Wayback Machine
- ^ 2008 general election results Archived December 21, 2008, at the Wayback Machine
- ^ 2010 general election results[permanent dead link]
- ^ 2010 general election results[permanent dead link]
- ^ U.S. Representative District 26 - Districtwide Results
External links edit
- Official Congresswoman Julia Brownley website — representing the 26th District of California.
- GovTrack.us: California's 26th congressional district
- RAND California Election Returns: District Definitions
- California Voter Foundation map — CD26
34°12′N 117°48′W / 34.2°N 117.8°W