


Summary
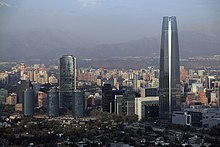
The economy of Chile is a market economy and high-income economy as ranked by the World Bank.[28] The country is considered one of South America's most prosperous nations,[29] leading the region in competitiveness, income per capita, globalization, economic freedom, and low perception of corruption.[30] Although Chile has high economic inequality, as measured by the Gini index,[31] it is close to the regional mean.[32]
 | |
| Currency | Chilean peso (CLP) |
|---|---|
| calendar year | |
Trade organizations | WTO, CPTPP, APEC, OECD, Mercosur (associate), CAN (associate) |
Country group | |
| Statistics | |
| Population | |
| GDP | |
| GDP rank | |
GDP growth | |
GDP per capita | |
GDP per capita rank | |
GDP by sector |
|
| 3.045% (2020)[7] | |
Population below poverty line | |
| 44.4 medium (2017, World Bank)[9] | |
| |
Labor force | |
Labor force by occupation |
|
| Unemployment | |
Average gross salary | CLP 957,741 / $1,082 monthly[17] (2022) |
| CLP 890,699 / $1,006 monthly[18][19] (2022) | |
Main industries | copper, lithium, other minerals, foodstuffs, fish processing, iron and steel, wood and wood products, transport equipment, cement, textiles |
| External | |
| Exports | |
Export goods | |
Main export partners |
|
| Imports | |
Import goods |
|
Main import partners | |
FDI stock | |
Gross external debt | |
| Public finances | |
| −2.8% (of GDP) (2020)[25] | |
| Revenues | 57.75 billion (2017 est.)[6] |
| Expenses | 65.38 billion (2017 est.)[6] |
| |
In 2006, Chile became the country with the highest nominal GDP per capita in Latin America.[33] In May 2010 Chile became the first South American country to join the OECD.[34] Tax revenues, all together 20.2069% of GDP in 2013, were the second lowest among the 34 OECD countries, and the lowest in 2010.[35] Chile has an inequality-adjusted human development index of 0.722, compared to 0.720, 0.710 and 0.576 for neighboring Argentina, Uruguay and Brazil, respectively. In 2017, only 0.7% of the population lived on less than US$1.90 a day.[36]
The Global Competitiveness Report for 2009–2010 ranked Chile as being the 30th most competitive country in the world and the first in Latin America, well above Brazil (56th), Mexico (60th), and Argentina (85th); it has since fallen out of the top 30.[33] The ease of doing business index, created by the World Bank, listed Chile as 34th in the world as of 2014, 41st for 2015, and 48th as of 2016.[37] The privatized national pension system (AFP) has an estimated total domestic savings rate of approximately 21% of GDP.[38]
History edit

After Spanish arrival in the 15th century Chilean economy came to revolve around autarchy estates called fundos and around the army that was engaged in the Arauco War. During early colonial times there were gold exports to Peru from placer deposits which soon depleted. Trade restrictions and monopolies established by the Spanish crown are credited for having held back economic development for much of the colonial times. As effect of these restrictions the country incorporated very few new crops and animal breeds after initial conquest. Other sectors that were held back by restrictions were the wine and mining industries. The Bourbon reforms in the 18th century eased many monopolies and trade restrictions.
In the 1830s Chile consolidated under the ideas of Diego Portales as a stable state open to foreign trade. Foreign investment in Chile grew over the 19th century. After the War of the Pacific the Chilean treasury grew by 900%. The League of Nations labeled Chile the country hardest hit by the Great Depression because 80% of government revenue came from exports of copper and nitrates, which were in low demand. After the Great Depression Chilean economic policies changed toward import substitution industrialization and the Production Development Corporation was established.
Under the influence of the Chicago Boys the Pinochet regime made of Chile a leading country in establishing neoliberal policies. These policies allowed large corporations to consolidate their power over the Chilean economy, leading to long-term economic growth.[39] The crisis of 1982 caused the appointment of Hernán Büchi as minister of finance and a sharp revision of economic policy. Despite a general selling of state property and contrary to neoliberal prescriptions, the regime retained the lucrative state owned mining company Codelco which stands for about 30% of government income.
According to the CIA World Factbook, during the early 1990s, Chile's reputation as a role model for economic reform was strengthened when the democratic government of Patricio Aylwin, who took over from the military in 1990, deepened the economic reform initiated by the military government. The Aylwin government departed significantly from the neoliberal doctrine of the Chicago boys, as evidenced by higher government expenditure on social programs to tackle poverty and poor quality housing.[40] Growth in real GDP averaged 8% from 1991 to 1997,[citation needed] but fell to half that level in 1998 because of tight monetary policies (implemented to keep the current account deficit in check) and lower exports due to the Asian financial crisis. Chile's economy has since recovered and has seen growth rates of 5–7% over the past several years.[citation needed]
After a decade of impressive growth rates, Chile began to experience a moderate economic downturn in 1999, brought on by unfavorable global economic conditions related to the Asian financial crisis, which began in 1997. The economy remained sluggish until 2003, when it began to show clear signs of recovery, achieving 4.0% real GDP growth.[41] The Chilean economy finished 2004 with growth of 6.0%. Real GDP growth reached 5.7% in 2005 before falling back to 4.0% in 2006. GDP expanded by 5.1% in 2007.[42]
Sectors edit
During 2012, the largest sectors by GDP were mining (mainly copper), business services, personal services, manufacturing and wholesale and retail trade. Mining also represented 59.5% of exports in the period, while the manufacturing sector accounted for 34% of exports, concentrated mainly in food products, chemicals and pulp, paper and others.[43]
Agriculture edit
Chile is one of the 5 largest world producers of cherry and cranberry, and one of the 10 largest world producers of grape, apple, kiwi, peach, plum and hazelnut, focusing on exporting high-value fruits.[44]
In 2018, Chile was the 9th largest producer of grapes in the world, with 2 million tons produced; the 10th largest producer of apples in the world, with 1.7 million tons produced; and the 6th largest producer of kiwi in the world, with 230 thousand tons produced, in addition to producing 1.4 million tons of wheat, 1.1 million tons of maize, 1.1 million tons of potatoes, 951 thousand tons of tomatoes, 571 thousand tons of oats, 368 thousand tons of onions, 319 thousand tons of peaches, 280 thousand tons of pears, 192 thousand tons of rice, 170 thousand tons of barley, 155 thousand tons of cherries, 151 thousand tons of lemons, 118 thousand tons of tangerines, 113 thousand tons of oranges, 110 thousand tons of olives, 106 thousand tons of cranberries, in addition to smaller productions of other agricultural products.[45]
Agriculture and allied sectors like forestry, logging and fishing accounts only for 4.9% of the GDP as of 2007 and employed 13.6% of the country's labor force. Some major agriculture products of Chile includes grapes, apples, pears, onions, wheat, corn, oats, peaches, garlic, asparagus, beans, beef, poultry, wool, fish and timber.[46]
Chile's position in the Southern Hemisphere leads to an agricultural season cycle opposite to those of the principal consumer markets, primarily located in the Northern Hemisphere.[47] Chile's extreme north–south orientation produces seven different macro-regions distinguished by climate and geographical features, which allows the country itself to stagger harvests and results in extended harvesting seasons.[47] However, the mountainous landscape of Chile limits the extent and intensity of agriculture so that arable land corresponds only to 2.62% of the total territory.[46] Through Chile's trade agreements, its agricultural products have gained access to a market controlling 77% of the world's GDP and by approximately 2012, 74% of Chilean agribusiness exports will be duty-free.[47]
Chile's principal growing region and agricultural heartland is the Central Valley delimited by the Chilean Coast Range in the west, the Andes in the east Aconcagua River by the north and Bío-Bío River by the south. In the northern half of Chile cultivation is highly dependent on irrigation. South of the Central Valley cultivation is gradually replaced by aquaculture, silviculture, sheep and cattle farming.
Salmon edit
Chile is the second largest producer of salmon in the world.[47] As of August 2007, Chile's share of worldwide salmon industry sales was 38.2%, rising from just 10% in 1990.[47] The average growth rate of the industry for the 20 years between 1984 and 2004 was 42% per year.[47] The presence of large foreign firms in the salmon industry has brought what probably most contributes to Chile's burgeoning salmon production, technology.[47] Technology transfer has allowed Chile to build its global competitiveness and innovation and has led to the expansion of production as well as to an increase in average firm size in the industry.[47] In November 2018, the Chinese company Joyvio Group (Legend Holdings) bought the Chilean salmon producer Australis Seafoods for $880 million, thus gaining control over 30% of all Chilean salmon exports.[48][49]
Forestry edit
The Chilean forestry industry grew to comprise 13% of the country's total exports in 2005, making it one of the largest export sectors for Chile.[47] Radiata Pine and Eucalyptus comprise the vast majority of Chile's forestry exports.[47] Within the forestry sector, the largest contributor to total production is pulp, followed by wood-based panels and lumber.[47] Due to popular and increasing demands for Chile's forestry products, the government is currently focusing on increasing the already vast acreage of Chile's Pine and Eucalyptus plantations as well as opening new industrial plants.[47]
Wine edit

Chile's unique geography and climate make it ideal for winegrowing and the country has made the top ten list of wine producers many times in the last few decades.
The popularity of Chilean wine has been attributed not just to the quantity produced but also to increasing levels of quality.[50] The combination of quantity and quality allows Chile to export excellent wines at reasonable prices to the international market.[51]
Mining edit
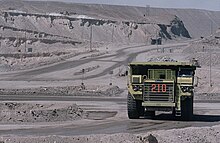
The mining sector in Chile is one of the pillars of Chilean economy. The Chilean government strongly supports foreign investment in the sector and has modified its mining industry laws and regulations to create a favorable investing environment for foreigners. Thanks to a large amount of copper resources, complaisant legislation and an unregulated investment environment, Chile has become one of the main copper producers, with almost 30% of the global annual copper output.[47][52]
In addition to copper, Chile was, in 2019, the world's largest producer of iodine[53] and rhenium,[54] the second largest producer of lithium[55] and molybdenum,[56] the sixth largest producer of silver,[57] the seventh largest producer of salt,[58] the eighth largest producer of potash,[59] the thirteenth producer of sulfur[60] and the thirteenth producer of iron ore[61] in the world. The country also has considerable gold production: between 2006 and 2017, the country produced annual amounts ranging from 35.9 tonnes in 2017 to 51.3 tonnes in 2013.[62]
Services edit
The service sector in Chile has grown fast and consistently in recent decades,[63] reinforced by the rapid development of communication and information technology, access to education and an increase in specialist skills and knowledge among the workforce.[64] Chilean foreign policy has recognized the importance of the tertiary sector or service sector to the economy, boosting its international liberalization and leading to the signing of several free trade area agreements. Chilean service exportation consists mainly of maritime and aeronautical services, tourism, retail (department stores, supermarkets, and shopping centers), engineering and construction services, informatics, health and education.[65]
Chile ranked first among Latin American countries (and No. 32 worldwide) in Adecco's 2019 Global Talent Competitiveness Index (GTCI).[66]
Finance edit
Chile's financial sector has grown quickly in recent years, with a banking reform law approved in 1997 that broadened the scope of permissible foreign activity for Chilean banks. The Chilean Government implemented a further liberalization of capital markets in 2001, and there is further pending legislation proposing further liberalization. Over the last ten years, people who live in Chile have enjoyed the introduction of new financial tools such as home equity loans, currency futures and options, factoring, leasing, and debit cards. The introduction of these new products has also been accompanied by an increased use of traditional instruments such as loans and credit cards. Chile's private pension system, with assets worth roughly $70 billion at the end of 2006, has been an important source of investment capital for the capital market. However, by 2009, it has been reported that $21 billion had been lost from the pension system to the global financial crisis.[67]
Tourism edit

Tourism in Chile has experienced sustained growth over the last decades. Chile received about 2.25 million foreign visitors in 2006,[68] up to 2.50 million in 2007[69] The percentages of foreign tourists arrivals by land, air and sea were, respectively, 55.3%, 40.5% and 4.2% for that year.[68] The two main gateways for international tourists visiting Chile are Arturo Merino Benítez International Airport and Paso Los Libertadores.
Chile has a great diversity of natural landscapes, from the Mars-like landscapes of the hyperarid Atacama Desert to the glacier-fed fjords of the Chilean Patagonia, passing by the winelands backdropped by the Andes of the Central Valley and the old-growth forests of the Lakes District. Easter Island and Juan Fernández Archipelago, including Robinson Crusoe Island, are also major attractions.
Many of the most visited attractions in Chile are protected areas. The extensive Chilean protected areas system includes 32 protected parks, 48 natural reserves and 15 natural monuments.[68]
Economic policies edit
According to the CIA World Factbook, Chile's "sound economic policies", maintained consistently since the 1980s, "have contributed to steady economic growth in Chile and have more than halved poverty rates."[42][46] The 1973–90 military government sold many state-owned companies, and the three democratic governments since 1990 have implemented export promotion policies[70][71] and continued privatization, though at a slower pace. The government's role in the economy is mostly limited to regulation, although the state continues to operate copper giant Codelco and a few other enterprises such as BancoEstado.
Under the compulsory private pension system, most formal sector employees pay 10% of their salaries into privately managed funds.[42]
As of 2006, Chile invested 0.6% of its annual GDP in research and development (R&D). Even then, two-thirds of that was government spending. Beyond its general economic and political stability, the government has also encouraged the use of Chile as an "investment platform" for multinational corporations planning to operate in the region.[specify] Chile's approach to foreign direct investment is codified in the country's Foreign Investment Law, which gives foreign investors the same treatment as Chileans. Registration is reported to be simple and transparent, and foreign investors are guaranteed access to the official foreign exchange market to repatriate their profits and capital.[42]
Faced with the financial crisis of 2007–2008, the government announced a $4 billion economic stimulus plan to spur employment and growth, and despite the global financial crisis, aimed for an expansion of between 2 percent and 3 percent of GDP for 2009. Nonetheless, economic analysts disagreed with government estimates and predicted economic growth at a median of 1.5 percent.[72] According to the CIA World FactBook, the GDP contracted an estimated −1.7% in 2009.[73]
The Chilean Government has formed a Council on Innovation and Competition, which is tasked with identifying new sectors and industries to promote. It is hoped that this, combined with some tax reforms to encourage domestic and foreign investment in research and development, will bring in additional FDI to new parts of the economy.[42]
According to The Heritage Foundation's Index of Economic Freedom in 2012, Chile has the strongest private property rights in Latin America, scoring 90 on a scale of 100.
Chile's AA− S&P credit rating is the highest in Latin America, while Fitch Ratings places the country one step below, in A+.[74]
There are three main ways for Chilean firms to raise funds abroad: bank loans, issuance of bonds, and the selling of stocks on U.S. markets through American Depository Receipts (ADRs). Nearly all of the funds raised through these means go to finance domestic Chilean investment. In 2006, the Government of Chile ran a surplus of $11.3 billion, equal to almost 8% of GDP. The Government of Chile continues to pay down its foreign debt, with public debt only 3.9% of GDP at the end of 2006.[42]
Fiscal policy edit
One of Chile's fiscal policy central features has been its counter-cyclical nature. This has been facilitated by the voluntary application since 2001 of a structural balance policy based on the commitment to an announced goal of a medium-term structural balance as a percentage of GDP. The structural balance nets out the effect of the economic cycle (including copper price volatility) on fiscal revenues and constrains expenditures to a correspondingly consistent level. In practice, this means that expenditures rise when activity is low and decrease in booms[75] The target was of 1% of GDP between 2001 and 2007, it was reduced to 0.5% in 2008 and then to 0% in 2009 in the wake of the global financial crisis.[76] In 2005, key elements of this voluntary policy were incorporated into legislation through the Fiscal Responsibility Law (Law 20,128).[75]
The Fiscal Responsibility Law also allowed for the creation of two sovereign wealth funds: the Pension Reserve Fund (PRF), to face increased expected old-age benefits liabilities, and the Economic and Social Stabilization Fund (ESSF), to stabilize fiscal spending by providing funds to finance fiscal deficits and debt amortization.[75][77] By the end of 2012, they had respective market values of US$5.883 million and US$14.998 million.[78]
The main taxes in Chile in terms of revenue collection are the value added tax (45.8% of total revenues in 2012) and the income tax (41.8% of total revenues in 2012).[79] The value added tax is levied on sales of goods and services (including imports) at a rate of 19%, with a few exemptions. The income tax revenue comprises different taxes. While there is a corporate income tax of 20% over profits from companies (called First Category Tax), the system is ultimately designed to tax individuals. Therefore, corporate income taxes paid constitute a credit towards two personal income taxes: the Global Complementary Tax (in the case of residents) or the Additional Tax (in the case of non-residents). The Global Complementary Tax is payable by those that have different sources of income, while those receiving income solely from dependent work are subject to the Second Category Tax. Both taxes are equally progressive in statutory terms, with a top marginal rate of 40%. Income arising from corporate activity under the Global Complementary Tax only becomes payable when effectively distributed to the individual. There are also special sales taxes on alcohol and luxury goods, as well as specific taxes on tobacco and fuel. Other taxes include the inheritance tax and custom duties.[80]
In 2012, general government expenditure reached 21.5% of GDP, while revenues were equivalent to 22% of GDP.[81] Gross financial debt amounted to 12.2% of GDP, while in net terms it was −6.9% of GDP, both well below OECD averages.[81]
Monetary policy edit
Chile's monetary authority is the Central Bank of Chile (CBoC). The CBoC pursues an inflation target of 3%, with a tolerance range of 1% (below or above).[82] Inflation has followed a relatively stable trajectory since the year 2000, remaining under 10%, despite the temporary surge of some inflationary pressures in the year 2008. The Chilean peso's rapid appreciation against the U.S. dollar in recent years has helped dampen inflation. Most wage settlements and loans are indexed, reducing inflation's volatility.
The CBoC is granted autonomous status by Chile's National Constitution, providing credibility and stability beyond the political cycle.[82][83] According to the Basic Constitutional Act of the Central Bank of Chile (Law 18,840), its main objectives are to safeguard "the stability of the currency and the normal functioning of internal and external payments".[84] To meet these objectives, the CBoC is enabled to use monetary and foreign exchange policy instruments, along with some discretion on financial regulation. In practice, the CBoC monetary policy is guided by an inflation targeting regime, while the foreign exchange policy is led by a floating exchange rate and, although unusual, the bank reserves the right to intervene in the foreign exchange markets.[82]
Trade policy edit
Chile is strongly committed to free trade and has welcomed large amounts of foreign investment. Chile has signed free trade agreements (FTAs) with a network of countries, including an FTA with the United States that was signed in 2003 and implemented in January 2004.[85]
Chile unilaterally lowered its across-the-board import tariff for all countries with which it does not have a trade agreement to 6% in 2003. Higher effective tariffs are charged only on imports of wheat, wheat flour, and sugar as a result of a system of import price bands. The price bands were ruled inconsistent with Chile's World Trade Organization (WTO) obligations in 2002, and the government has introduced legislation to modify them. Under the terms of the U.S.–Chile FTA, the price bands will be completely phased out for U.S. imports of wheat, wheat flour, and sugar within 12 years.[42]
Chile is a strong proponent of pressing ahead on negotiations for a Free Trade Area of the Americas (FTAA) and is active in the WTO's Doha round of negotiations, principally through its membership in the G-20 and Cairns Group.[42]
Most imports are not subject to the full statutory tariff, due to the extensive preferences negotiated outside the multilateral system through Regional Trade Agreements (RTAs). By the last version of the World Trade Organization's Trade Policy Review (October 2009), Chile had signed 21 RTAs with 57 countries and the number has continued to rise in recent years[86]
More recently, Chile has also been an active participant of deeper plurilateral trade agreement negotiations. Notably, Chile is currently in talks with eleven other economies in the Trans-Pacific Partnership (TPP), a proposed agreement that would stem from the existing P-4 Agreement between Brunei, Chile, New Zealand and Singapore. Chile has signed some form of bilateral or plurilateral agreement with each of the parties at TPP, although with different degrees of integration.[87]
Chile is also a party in conversations to establish the Pacific Alliance along with Peru, Mexico and Colombia.[88]
Foreign trade edit

2006 was a record year for Chilean trade. Total trade registered a 31% increase over 2005. During 2006, exports of goods and services totaled US$58 billion, an increase of 41%. This figure was somewhat distorted by the skyrocketing price of copper. In 2006, copper exports reached a historical high of US$33.3 billion. Imports totaled US$35 billion, an increase of 17% compared to the previous year. Chile thus recorded a positive trade balance of US$2.3 billion in 2006.[42]
The main destinations for Chilean exports were the Americas (US$39 billion), Asia (US$27.8 billion) and Europe (US$22.2 billion). Seen as shares of Chile's export markets, 42% of exports went to the Americas, 30% to Asia and 24% to Europe. Within Chile's diversified network of trade relationships, its most important partner remained the United States. Total trade with the U.S. was US$14.8 billion in 2006. Since the U.S.–Chile Free Trade Agreement went into effect on 1 January 2004, U.S.–Chilean trade has increased by 154%. Internal Government of Chile figures show that even when factoring out inflation and the recent high price of copper, bilateral trade between the U.S. and Chile has grown over 60% since then.[42]
Total trade with Europe also grew in 2006, expanding by 42%. The Netherlands and Italy were Chile's main European trading partners. Total trade with Asia also grew significantly at nearly 31%. Trade with Korea and Japan grew significantly, but China remained Chile's most important trading partner in Asia. Chile's total trade with China reached U.S. $8.8 billion in 2006, representing nearly 66% of the value of its trade relationship with Asia.[42]=
The growth of exports in 2006 was mainly caused by a strong increase in sales to the United States, the Netherlands, and Japan. These three markets alone accounted for an additional US$5.5 billion worth of Chilean exports. Chilean exports to the United States totaled US$9.3 billion, representing a 37.7% increase compared to 2005 (US$6.7 billion). Exports to the European Union were US$15.4 billion, a 63.7% increase compared to 2005 (US$9.4 billion). Exports to Asia increased from US$15.2 billion in 2005 to US$19.7 billion in 2006, a 29.9% increase.[42]
During 2006, Chile imported US$26 billion from the Americas, representing 54% of total imports, followed by Asia at 22%, and Europe at 16%. Mercosur members were the main suppliers of imports to Chile at US$9.1 billion, followed by the United States with US$5.5 billion and the European Union with US$5.2 billion. From Asia, China was the most important exporter to Chile, with goods valued at US$3.6 billion. Year-on-year growth in imports was especially strong from a number of countries – Ecuador (123.9%), Thailand (72.1%), Korea (52.6%), and China (36.9%).[42]
Chile's overall trade profile has traditionally been dependent upon copper exports. The state-owned firm CODELCO is the world's largest copper-producing company, with recorded copper reserves of 200 years. Chile has made an effort to expand nontraditional exports. The most important non-mineral exports are forestry and wood products, fresh fruit and processed food, fishmeal and seafood, and wine.[42]
Trade agreements edit

Over the last several years, Chile has signed FTAs with the European Union, South Korea, New Zealand, Singapore, Brunei, China, and Japan. It reached a partial trade agreement with India in 2005 and began negotiations for a full-fledged FTA with India in 2006. Chile conducted trade negotiations in 2007 with Australia, Malaysia, and Thailand, as well as with China to expand an existing agreement beyond just trade in goods. Chile concluded FTA negotiations with Australia and an expanded agreement with China in 2008. The members of the P4 (Chile, Singapore, New Zealand, and Brunei) also plan to conclude a chapter on finance and investment in 2008.[42]
Successive Chilean governments have actively pursued trade-liberalizing agreements. During the 1990s, Chile signed free trade agreements (FTA) with Canada, Mexico, and Central America. Chile also concluded preferential trade agreements with Venezuela, Colombia, and Ecuador. An association agreement with Mercosur-Argentina, Brazil, Paraguay, and Uruguay-went into effect in October 1996. Continuing its export-oriented development strategy, Chile completed landmark free trade agreements in 2002 with the European Union and South Korea. Chile, as a member of the Asia-Pacific Economic Cooperation (APEC) organization, is seeking to boost commercial ties to Asian markets. To that end, it has signed trade agreements in recent years with New Zealand, Singapore, Brunei, India, China, and most recently Japan. In 2007, Chile held trade negotiations with Australia, Thailand, Malaysia, and China. In 2008, Chile hopes to conclude an FTA with Australia, and finalize an expanded agreement (covering trade in services and investment) with China. The P4 (Chile, Singapore, New Zealand, and Brunei) also plan to expand ties through adding a finance and investment chapter to the existing P4 agreement. Chile's trade talks with Malaysia and Thailand are also scheduled to continue in 2008.[42]
After two years of negotiations, the United States and Chile signed an agreement in June 2003 that will lead to completely duty-free bilateral trade within 12 years. The U.S.-Chile FTA entered into force 1 January 2004, following approval by the U.S. and Chilean congresses. The FTA has greatly expanded U.S.-Chilean trade ties, with total bilateral trade jumping by 154% during the FTA's first three years.[42] On 1 January 2014, Chile-Vietnam Free Trade Agreement officially took effect.[90]
Issues edit
Unemployment hovered at 8–10% after the start of the economic slowdown in 1999, above the 7% average for the 1990s. Unemployment finally dipped to 7.8% in 2006, and continued to fall in 2007, averaging 6.8% monthly (up to August).[91] Wages have risen faster than inflation as a result of higher productivity, boosting national living standards. The percentage of Chileans with household incomes below the poverty line – defined as twice the cost of satisfying a person's minimal nutritional needs – fell from 45.1% in 1987 to 11.7% in 2015, according to government polls.[92] Critics in Chile, however, argue that poverty figures are considerably higher than those officially published; until 2016, the government defined the poverty line based on an outdated 1987 household consumption poll, instead of more recent polls from 1997 or 2007. According to critics who use data from the 1997 poll, the poverty rate goes up to 29%; a study published in 2017 claims that it reaches 26%.[93] Using the relative yardstick favoured in many European countries, 27% of Chileans would be poor, according to Juan Carlos Feres of the ECLAC.[94][95] Starting in 2016, a new Multidimensional Poverty Index is also used, which reached 20.9% using 2015 data.[92]
The percent of total income earned by the richest 20% of the Chilean population in 2000 was 61.0% of GDP, while the percent of total income earned by the poorest 20% of the Chilean population was 3.3% of GDP.[96] Chile's Gini Coefficient in 2003 (53.8) has slightly changed in comparison with the value in 1995 (56.4). In 2005 the 10% poorest among the Chileans received 1.2% of GNP (2000 = 1.4%), while the 10% richest received 47% of GNP (2000 = 46%).[97]
Regarding the census, assessments have exhibited mixed results. An initial evaluation by a domestic independent experts panel released in August 2013 placed the omission rate in 9.3%, three times as much as other census in the region, and recommended annulling the census to hold a new version in 2015.[98] The government sought an assessment by international experts before making a final decision.[81] The team, which included three experts that represented the World Bank and the E.U. Statistics Commission, found "no basis for doubting the usability of the census data for most, if perhaps not all, of the customary uses" and recommended its release subject to the elimination of the imputation of housing units not observed on thBy 2021, the combined wealth of Chile's billionaires represented 16.1% of the country's gross domestic product (GDP
Historians generally explain the origin of the social gap by tracing it back to colonial times, when most land was divided between Spaniards and their descendants. This gave rise to the hacienda, in which society was divided between owners, employees, tenants and workers. Since this agrarian inequality, the concentration of wealth has spread to other economic sectors that exploit natural resources, such as mining. In more recent history, social inequality deepened in the 1970s and 1980s under Augusto Pinochet's regime, with the privatization of public enterprises in favor of large family fortunes, the repression of trade unions and the rejection of the welfare state. As social mobility is very low in Chile, social status is passed down from generation to generation.e ground during the enumeration and the concurrent publication of a methodological and administrative report.[99][100]
Social inequalities edit
By 2021, the combined wealth of Chile's billionaires represented 16.1% of the country's gross domestic product (GDP).[101]
Historians generally explain the origin of the social gap by tracing it back to colonial times, when most land was divided between Spaniards and their descendants. This gave rise to the hacienda, in which society was divided between owners, employees, tenants and workers. Since this agrarian inequality, the concentration of wealth has spread to other economic sectors that exploit natural resources, such as mining. In more recent history, social inequality deepened in the 1970s and 1980s under Augusto Pinochet's regime, with the privatization of public enterprises in favor of large family fortunes, the repression of trade unions and the rejection of the welfare state. As social mobility is very low in Chile, social status is often passed down from generation to generation.[101]
Statistics edit
Main economic indicators edit
The following table shows the main economic indicators in 1980–2021 (with IMF staff estimates in 2024–2029). Inflation below 5% is in green.[102]
| Year | GDP
(in Bil. US$PPP) |
GDP per capita
(in US$ PPP) |
GDP
(in Bil. US$nominal) |
GDP per capita
(in US$ nominal) |
GDP growth
(real) |
Inflation rate
(in Percent) |
Unemployment
(in Percent) |
Government debt
(in % of GDP) |
|---|---|---|---|---|---|---|---|---|
| 1980 | 38.1 | 3,411.9 | 29.0 | 2,597.5 | 11.5% | n/a | ||
| 1981 | n/a | |||||||
| 1982 | n/a | |||||||
| 1983 | n/a | |||||||
| 1984 | n/a | |||||||
| 1985 | n/a | |||||||
| 1986 | n/a | |||||||
| 1987 | n/a | |||||||
| 1988 | n/a | |||||||
| 1989 | n/a | |||||||
| 1990 | n/a | |||||||
| 1991 | ||||||||
| 1992 | ||||||||
| 1993 | ||||||||
| 1994 | ||||||||
| 1995 | ||||||||
| 1996 | ||||||||
| 1997 | ||||||||
| 1998 | ||||||||
| 1999 | ||||||||
| 2000 | ||||||||
| 2001 | ||||||||
| 2002 | ||||||||
| 2003 | ||||||||
| 2004 | ||||||||
| 2005 | ||||||||
| 2006 | ||||||||
| 2007 | ||||||||
| 2008 | ||||||||
| 2009 | ||||||||
| 2010 | ||||||||
| 2011 | ||||||||
| 2012 | ||||||||
| 2013 | ||||||||
| 2014 | ||||||||
| 2015 | ||||||||
| 2016 | ||||||||
| 2017 | ||||||||
| 2018 | ||||||||
| 2019 | ||||||||
| 2020 | ||||||||
| 2021 | ||||||||
| 2022 | ||||||||
| 2023 | ||||||||
| 2024 | ||||||||
| 2025 | ||||||||
| 2026 | ||||||||
| 2027 | ||||||||
| 2028 | ||||||||
| 2029 |
GDP composition edit
Main macroeconomic aggregates of GDP.
| Aggregate | 2015 (millions of CLP$) |
% | Change year-on-year (%) |
|---|---|---|---|
| Private consumption | 101,141,482 | 64.4 | 1.5 |
| Government consumption | 21,103,758 | 13.4 | 5.8 |
| Changes in inventories | −391,923 | −0.2 | — |
| Gross fixed capital formation | 35,707,922 | 22.7 | −1.5 |
| (Exports) | (47,221,915) | (30.1) | −1.9 |
| (Imports) | (47,652,270) | (30.3) | −2.8 |
| Exports minus Imports | −430,355 | −0.3 | — |
| GDP | 157,130,884 | 100.0 | 2.1 |
Note: Data are preliminary. Source: Cuentas Nacionales de Chile – Evolución de la actividad económica en el año 2015 (p. 29), Central Bank of Chile, accessed on 23 March 2016.
GDP by sector edit
Gross domestic product by sector of the economy.
| Sector | 2011 (millions of CLP$) |
% |
|---|---|---|
| Agriculture and forestry | 3,328,749 | 2.8 |
| Fishing | 424,545 | 0.4 |
Mining
|
18,262,657 16,190,770 2,071,888 |
15.2 13.5 1.7 |
| Manufacturing industry | 13,129,927 3,123,930 1,898,666 315,070 419,276 1,593,821 964,591 1,963,145 858,837 1,992,590 |
10.9 2.6 1.6 0.3 0.3 1.3 0.8 1.6 0.7 1.7 |
| Electricity, gas and water | 2,829,820 | 2.4 |
| Construction | 8,916,291 | 7.4 |
| Retail | 9,467,766 | 7.9 |
| Restaurants and hotels | 1,917,615 | 1.6 |
| Transportation | 4,906,137 | 4.1 |
| Communications | 2,319,387 | 1.9 |
| Financial services | 5,049,548 | 4.2 |
| Business services | 15,655,893 | 13.0 |
| Real estate services | 6,021,032 | 5.0 |
| Personal services (health, education, and other services) | 12,793,180 | 10.6 |
| Public administration | 5,207,342 | 4.3 |
| GDP at factor cost | 110,229,891 | 91.7 |
| VAT taxes | 9,347,632 | 7.8 |
| Import duties | 655,081 | 0.5 |
| GDP at market prices | 120,232,603 | 100.0 |
Note: 2011 data are preliminary. Source: Cuentas Nacionales – Evolución de la actividad económica en el año 2011 (p. 34). Central Bank of Chile. accessed on 22 March 2012.
Top exports edit

Chile's top exports in 2013.
| Export | Millions of US dollars FOB |
% |
|---|---|---|
| Mining | 43,937 | 49.11 |
| Copper | 40,158 | 44.88 |
| Cathodes | 18,804 | 21.02 |
| Concentrates | 16,883 | 18.87 |
| Gold | 1,384 | 1.55 |
| Iron | 1,379 | 1.54 |
| Silver | 379 | 0.42 |
| Lithium carbonate | 226 | 0.25 |
| Molybdenum concentrate | 178 | 0.20 |
| Sea salt and table salt | 120 | 0.13 |
| Agriculture, silviculture and fishing | 5,749 | 6.43 |
| Fruit sector | 4,738 | 5.30 |
| Grape | 1,605 | 1.79 |
| Apple | 843 | 0.94 |
| Vaccinium | 461 | 0.52 |
| Cherry | 391 | 0.44 |
| Kiwifruit | 245 | 0.27 |
| Avocado | 185 | 0.21 |
| Pear | 168 | 0.19 |
| Plum | 152 | 0.17 |
| Other agriculture | 830 | 0.93 |
| Corn kernel | 361 | 0.40 |
| Vegetable seed | 158 | 0.18 |
| Extractive fishing | 149 | 0.17 |
| Silviculture sector | 33 | 0.04 |
| Industrial | 26,997 | 30.17 |
| Foodstuff | 8,298 | 9.28 |
| Salmon | 2,772 | 3.10 |
| Trout | 766 | 0.86 |
| Mollusks and crustaceans | 498 | 0.56 |
| Pork | 454 | 0.51 |
| Fish meal | 418 | 0.47 |
| Dried fruit | 383 | 0.43 |
| Frozen fruit | 337 | 0.38 |
| Poultry meat | 276 | 0.31 |
| Fruit juice | 240 | 0.27 |
| Canned fruit | 156 | 0.17 |
| Fish oil | 109 | 0.12 |
| Hake | 107 | 0.12 |
| Canned fish | 53 | 0.06 |
| Chemical products | 5,447 | 6.09 |
| Fertilizers | 860 | 0.96 |
| Iodine | 839 | 0.94 |
| Molybdenum oxide | 761 | 0.85 |
| Tires | 393 | 0.44 |
| Potassium nitrate | 296 | 0.33 |
| Methanol | 56 | 0.06 |
| Cellulose, paper and other | 3,607 | 4.03 |
| Bleached and semi-bleached eucalyptus pulp | 1,262 | 1.41 |
| Bleached and semi-bleached coniferous pulp | 1,261 | 1.41 |
| Cardboard | 329 | 0.37 |
| Raw coniferous pulp | 281 | 0.31 |
| Metallic products, machinery and equipment | 2,796 | 3.12 |
| Machinery and equipment | 1,416 | 1.58 |
| Transport material | 879 | 0.98 |
| Metallic manufactures | 500 | 0.56 |
| Beverage and tobacco | 2,407 | 2.69 |
| Bottled wine | 1,560 | 1.74 |
| Bulk wine and others | 417 | 0.47 |
| Non-alcoholic beverages | 297 | 0.33 |
| Forestry and wood furniture | 2,272 | 2.54 |
| Lumber | 814 | 0.91 |
| Wood fibreboards | 350 | 0.39 |
| Woodchips | 315 | 0.35 |
| Profiled timber | 273 | 0.31 |
| Plywood | 254 | 0.28 |
| Basic metals industry | 1,106 | 1.24 |
| Copper wire | 457 | 0.51 |
| Ferromolybdenum | 223 | 0.25 |
| Other industrial products | 1,064 | 1.19 |
| Goods total | 76,684 | 85.71 |
| Transport | 6,357 | 7.11 |
| Travel | 2,219 | 2.48 |
| Others | 4,211 | 4.71 |
| Services total | 12,787 | 14.29 |
| Total exports | 89,471 | 100.00 |
Source: Central Bank of Chile's statistics database.
See also edit
Bibliography edit
- Collier, Simon and Sater, William F. A History of Chile, 1808–2002, New York and London, Cambridge University Press, 2004.
- Constable, Pamela and Valenzuela, Arturo. A Nation of Enemies: Chile Under Pinochet. New York, W. W. Norton & Company, 1993.
- Paley, Julia. Marketing Democracy: Power and Social Movements in Post-Dictatorship Chile. University of California Press, 2001
- Winn, Peter (editor), Victims of the Chilean Miracle: Workers and Neoliberalism in the Pinochet Era, 1973–2002. Durham, NC: Duke University Press, 2004.
References edit
- ^ "World Economic Outlook Database, April 2019". IMF.org. International Monetary Fund. Retrieved 29 September 2019.
- ^ "World Bank Country and Lending Groups". datahelpdesk.worldbank.org. World Bank. Retrieved 29 September 2019.
- ^ "Population, total - Chile". The World Bank Group. Retrieved 25 November 2021.
- ^ a b c d "Report for Selected Countries and Subjects: April 2023". imf.org. International Monetary Fund.
- ^ a b c "The outlook is uncertain again amid financial sector turmoil, high inflation, ongoing effects of Russia's invasion of Ukraine, and three years of COVID". International Monetary Fund. 11 April 2023.
- ^ a b c d e f g h i "Chile". The World Factbook (2024 ed.). Central Intelligence Agency. Retrieved 2 April 2019. (Archived 2019 edition.)
- ^ "Inflation, consumer prices (annual %) - Chile". The World Bank Group. Retrieved 25 November 2021.
- ^ "Poverty headcount ratio at national poverty lines (% of population) - Chile". The World Bank Group. Retrieved 25 November 2021.
- ^ "GINI index (World Bank estimate)". data.worldbank.org. World Bank. Retrieved 2 April 2019.
- ^ "Human Development Report 2023/2024" (PDF). United Nations Development Programme. 13 March 2024. Archived (PDF) from the original on 13 March 2024. Retrieved 7 April 2024.
- ^ "Inequality-adjusted HDI (IHDI)". hdr.undp.org. UNDP. Retrieved 17 December 2022.
- ^ "Labor force, total - Chile". The World Bank Group. Retrieved 25 November 2021.
- ^ "Employment to population ratio, 15+ total (%) (modeled ILO estimate) - Chile". The World Bank Group. Retrieved 25 November 2021.
- ^ "Unemployment, total (% of total labor force) (modeled ILO estimate) - Chile". The World Bank Group. Retrieved 25 November 2021.
- ^ "Unemployment rate". data.oecd.org. OECD. Archived from the original on 26 December 2019. Retrieved 26 December 2019.
- ^ "Youth unemployment rate". data.oecd.org. OECD. Retrieved 27 April 2020.
- ^ [1]
- ^ [2]
- ^ [3]
- ^ "Exports of goods and services (current US$) - Chile". The World Bank Group. Retrieved 25 November 2021.
- ^ a b "Learn More About Trade in Chile". OEC. Archived from the original on 6 April 2015. Retrieved 15 April 2015.
- ^ "Imports of goods and services (current US$) - Chile". The World Bank Group. Retrieved 25 November 2021.
- ^ "Current account balance (% of GDP) - Chile". The World Bank Group. Retrieved 25 November 2021.
- ^ "General government debt - Total, % of GDP, 2020". Organisation for Economic Co-operation and Development. Retrieved 25 November 2021.
- ^ "General government deficitTotal, % of GDP, 2019 or latest available". Organisation for Economic Co-operation and Development. Retrieved 25 November 2021.
- ^ "Moody's raises Chile credit rating to Aa3". Reuters. Archived from the original on 7 September 2014. Retrieved 6 September 2014.
- ^ "Total reserves (includes gold, current US$) - Chile". The World Bank Group. Retrieved 25 November 2021.
- ^ "Chile". Retrieved 11 June 2015.
- ^ "Country profile: Chile". BBC News. 16 December 2009. Retrieved 31 December 2009.
- ^ "Human and income poverty: developing countries". UNDP. Archived from the original on 12 February 2009. Retrieved 19 May 2008.
- ^ "Encuesta Casen" (PDF). Mideplan. 2007. Archived from the original (PDF) on 25 March 2009.
- ^ Inequality: Chile’s Real Position Archived 3 December 2013 at the Wayback Machine
- ^ a b "Archived copy" (PDF). Archived from the original (PDF) on 30 October 2010. Retrieved 18 February 2011.
{{cite web}}: CS1 maint: archived copy as title (link) - ^ "Chile's accession to the OECD". OECD.org. 7 May 2010. Retrieved 7 May 2010.
- ^ OECD: Compare your country by tax rate, access date 13 December 2014
- ^ "Poverty headcount ratio at $1.90 a day (2011 PPP) (% of population) – Chile". data.worldbank.org. World Bank. Retrieved 5 February 2020.
- ^ "Doing Business in Chile 2013". World Bank. Archived from the original on 14 September 2018. Retrieved 21 October 2012.
- ^ "Archived copy" (PDF). Archived from the original (PDF) on 12 May 2012. Retrieved 13 July 2013.
{{cite web}}: CS1 maint: archived copy as title (link) The Chilean pension system - ^ Ricardo Ffrench-Davis, Economic Reforms in Chile: From Dictatorship to Democracy, University of Michigan Press, 2002, ISBN 9780472112326, p. 7
- ^ Dominguez, Jorge (2003). Constructing democratic governance in Latin America. JHU Press. ISBN 1421409798.
- ^ [4] Chile GDP – real growth rate
- ^ a b c d e f g h i j k l m n o p q "Development and Breakdown of Democracy, 1830–1973". Country Studies. Library of Congress. 31 March 1994.
- ^ Central Bank of Chile Statistical Database. National Accounts and External Sector Statistics.
- ^ "Chile en 2018, por FAO".
- ^ "Chile production in 2018, by FAO".
- ^ a b c Chile. The World Factbook. Central Intelligence Agency.
- ^ a b c d e f g h i j k l m "Estudios". AmCham Chile. 22 January 2008. Retrieved 11 June 2015.
- ^ (in Spanish) SalmonChile: compra de Australis Seafoods demuestra que salmón tiene futuro en China Archived 21 December 2019 at the Wayback Machine, Elmercurio.com, 19 November 2018
- ^ (in Spanish) Grupos extranjeros pasarían a controlar 37% de los envíos de salmón chileno, Terram.cl
- ^ Casa Real: Chile’s first wine legend Archived 22 November 2013 at the Wayback Machine www.thisischile.cl Friday, 15 November 2013 retrieved 22 November 2013
- ^ Viticultural Paradise Archived 10 December 2013 at the Wayback Machine www.winesofchile.org Retrieved 22 November 2013
- ^ "Copper production in 2019 by USGS" (PDF).
- ^ "USGS Iodine Production Statistics" (PDF).
- ^ "USGS Rhenium Production Statistics" (PDF).
- ^ "USGS Lithium Production Statistics" (PDF).
- ^ "USGS Molybdenum Production Statistics" (PDF).
- ^ "USGS Silver Production Statistics" (PDF).
- ^ "USGS Salt Production Statistics" (PDF).
- ^ "USGS Potash Product ion Statistics" (PDF).
- ^ "USGS Sulfur Production Statistics" (PDF).
- ^ "USGS Iron Ore Production Statistics" (PDF).
- ^ Gold Production in Chile
- ^ "PATRONES DE ESPECIALIZACIÓN Y CRECIMIENTO SECTORIAL EN CHILE]" (PDF). Archived from the original (PDF) on 13 June 2007. Central Bank of Chile Roberto Álvarez, Rodrigo Fuentes | Working Papers | N° 288 |December 2004
- ^ "Según informe el crecimiento de la educación superior en Chile superó la media de la Ocde" [According to a report, the growth of higher education in Chile exceeded the OECD average]. www.latercera.om (in Spanish). 6 June 2013. Archived from the original on 27 June 2013.
- ^ Economía Crecimiento Sostenido Archived 3 February 2014 at the Wayback Machine "Chile en el Exterior". Archived from the original on 2 October 2015. Retrieved 3 October 2015. 27 January 2014
- ^ (in Spanish) Mike Cortez, América Latina Rezagada En Talento De Acuerdo Con Ranking De Adecco Archived 20 February 2019 at the Wayback Machine, Latam-outsource.com, 22 January 2019
- ^ "An uncertain future". GlobalPost. Archived from the original on 11 August 2010. Retrieved 17 December 2009.
- ^ a b c "2006 Tourism Report". INE. Archived from the original on 30 July 2008. Retrieved 5 August 2008.
- ^ "Archived copy" (PDF). Archived from the original (PDF) on 19 August 2008. Retrieved 18 November 2008.
{{cite web}}: CS1 maint: archived copy as title (link) - ^ [5] USAID
- ^ "Archived copy" (PDF). Archived from the original (PDF) on 21 December 2013. Retrieved 4 August 2012.
{{cite web}}: CS1 maint: archived copy as title (link) Export dynamism and growth in Chile since the 1980s - ^ "Chile finmin says no recession seen in 2009-report". Reuters. 10 January 2009. Retrieved 17 December 2009.
- ^ "Chile". Indigenous Chic. Archived from the original on 20 September 2017. Retrieved 22 March 2018.
- ^ Sebastian Boyd, "Chile Raised to 4th-Highest Rating at Standard & Poor’s". Bloomberg News, 26 December 2012.
- ^ a b c Rodríguez, J., C. Tokman and A. Vega (2007). "Structural balance policy in Chile". OECD Journal on Budgeting 7(2), pp. 59–92.
- ^ Corbo, Vittorio. La política fiscal chilena. Blogs from El Mercurio Newspaper. 25 August 2013.
- ^ Ministry of Finance. "About the Funds". Archived from the original on 13 June 2015. Retrieved 11 June 2015.
- ^ Ministerio de Hacienda. "Informe Anual". Archived from the original on 13 June 2015. Retrieved 11 June 2015.
- ^ "Ingresos Tributarios Anuales". Retrieved 11 June 2015.
- ^ "Information for Foreign Investors". Archived from the original on 26 February 2015. Retrieved 11 June 2015.
- ^ a b c OECD (2013), OECD Economic Surveys: Chile 2013.[permanent dead link] OECD Publishing.
- ^ a b c "Central Bank of Chile: Monetary Policy in an Inflation Targeting Framework". Archived 21 December 2013 at the Wayback Machine Central Bank of Chile, January 2007.
- ^ "Central Bank of Chile website, About, Functions". bcentral.cl. Archived from the original on 29 November 2013. Retrieved 22 March 2018.
- ^ Law 18,840, Basic Constitutional Act of the Central Bank of Chile Archived 20 January 2013 at the Wayback Machine, Title I, Section 3.
- ^ "MAX - Unsupported Browser Warning". Archived from the original on 28 March 2016. Retrieved 13 July 2013. USA–Chile FTA Final Text
- ^ Trade Policy Review Chile, 2009, World Trade Organization.
- ^ Directorate of International Economic Relations website, Trade Agreements (in Spanish).
- ^ "The growing Pacific Alliance, Join the club" The Economist, April 29, 2013.
- ^ "Chile ranks fifth globally in wine exports and eighth in production". Santiago Times.
- ^ "Vietnam-Chile Free Trade Agreement (VCFTA) – WTO and International trade Policies". wtocenter.vn. Archived from the original on 20 September 2017. Retrieved 22 March 2018.
- ^ "Chilean Central Bank". Archived from the original on 13 May 2011.
- ^ a b "Casen 2015, Situación de la pobreza en Chile" (PDF). Ministerio de Desarrollo Social. 22 September 2016. Archived from the original (PDF) on 3 April 2018. Retrieved 11 November 2017.
- ^ "Una muy necesaria corrección: Hay cuatro millones de pobres en Chile". El Mercurio. 14 October 2007. Retrieved 22 October 2007.
- ^ "Destitute no more". The Economist. 16 August 2007. Retrieved 22 October 2007. (subscription required)
- ^ "Estudio de Fundación Sol revela que la pobreza en Chile superaría el 26%, más del doble de las cifras oficiales". El Mostrador. 31 July 2017. Retrieved 11 November 2017.
- ^ "eco_cou_152.xls" (PDF). Archived from the original (PDF) on 19 April 2009. Retrieved 31 January 2010.
- ^ "Document of Strategy Chile" (PDF). Archived from the original (PDF) on 19 December 2008. Retrieved 31 January 2010.
- ^ Eva Vergara, "Chile commission recommends scrapping 2012 census". BloombergBussinessweek News (AP), 7 August 2013.
- ^ Katie Steefel, "Experts deem flawed 2012 Census useable, Bachelet disagrees". The Santiago Times, 22 November 2013. [dead link]
- ^ Roberto Bianchini, Griffith Feeney and Rajendra Singh, "Report of the International Commission on the 2012 Population and Housing Census of Chile". Archived 6 December 2013 at the Wayback Machine National Statistics Institute (INE) website, 22 November 2013.
- ^ a b "Riqueza extrema: Chile, el país donde los ultrarricos tienen el patrimonio más grande de América Latina". BBC News Mundo (in Spanish). Retrieved 28 May 2023.
- ^ "Report for Selected Countries and Subjects".
External links edit
- Economic Development in Chile at Curlie
- Chile; A Top Stock market Performer
- The Economic Transformation of Chile: A Model of Progress – HACER
- Invest in Chile Archived 8 March 2007 at the Wayback Machine
- World Reviews on Chile – this is Chile
- Chile Export, Import, Trade Balance
- Chile Trade
- Tariffs applied by Chile as provided by ITC's ITC Market Access Map[permanent dead link], an online database of customs tariffs and market requirements