


Summary
The economy of Hungary is a high-income mixed economy, ranked as the 9th most complex economy according to the Economic Complexity Index.[25] Hungary is a member of the Organisation for Economic Co-operation and Development (OECD) with a very high human development index and a skilled labour force, with the 22nd lowest income inequality by Gini index in the world. The Hungarian economy is the 53rd-largest economy in the world (out of 188 countries measured by IMF) with $265.037 billion annual output,[26] and ranks 41st in the world in terms of GDP per capita measured by purchasing power parity. Hungary has an export-oriented market economy with a heavy emphasis on foreign trade; thus the country is the 35th largest export economy in the world. The country had more than $100 billion of exports in 2015, with a high trade surplus of $9.003 billion, of which 79% went to the European Union (EU) and 21% was extra-EU trade.[27] Hungary's productive capacity is more than 80% privately owned, with 39.1% overall taxation, which funds the country's welfare economy. On the expenditure side, household consumption is the main component of GDP and accounts for 50% of its total, followed by gross fixed capital formation with 22% and government expenditure with 20%.[28]
| |
| Currency | Hungarian forint (HUF) |
|---|---|
| Calendar year | |
Trade organisations | European Union, OECD, AIIB and WTO |
Country group | |
| Statistics | |
| Population | 9,609,641 (2022)[3] |
| GDP | |
| GDP rank | |
GDP growth |
|
GDP per capita | |
GDP per capita rank | |
GDP by sector |
|
| 5.20% (2024)[6] | |
| 0.90%[7] | |
Population below poverty line | |
| 28.3 low (2020, Eurostat)[10] | |
Labour force | |
Labour force by occupation |
|
| Unemployment | |
Average gross salary | €1,456 per month |
| €1,002 per month | |
Main industries | mining, metallurgy, construction materials, food processing, electronics, textiles, chemicals, pharmaceuticals, motor vehicles, information technology |
| External | |
| Exports | $125.75 billion (2017)[17] |
Export goods |
|
Main export partners |
|
| Imports | $115.63 billion (2017)[17] |
Import goods |
|
Main import partners |
|
FDI stock | |
| $4.39 billion (2017 est.)[5] | |
Gross external debt | $138.1 billion (31 December 2017 est.)[5] |
| Public finances | |
| Revenues | 44.0% of GDP (2019)[18] |
| Expenses | 46.1% of GDP (2019)[18] |
| Economic aid |
|
| $28 billion (31 December 2017 est.)[5] | |
All values, unless otherwise stated, are in US dollars. | |


Hungary continues to be one of the leading nations in Central and Eastern Europe for attracting foreign direct investment: the inward FDI in the country was $119.8 billion in 2015, while Hungary invests more than $50 billion abroad.[29] As of 2015, the key trading partners of Hungary were Germany, Austria, Romania, Slovakia, France, Italy, Poland and the Czech Republic.[30] Major industries include food processing, pharmaceuticals, motor vehicles, information technology, chemicals, metallurgy, machinery, electrical goods, and tourism (in 2014 Hungary welcomed 12.1 million international tourists).[31] Hungary is the largest electronics producer in Central and Eastern Europe. Electronics manufacturing and research are among the main drivers of innovation and economic growth in the country. In the past 20 years Hungary has also grown into a major center for mobile technology, information security, and related hardware research.[32] The employment rate in the economy was 68.7% in January 2017,[33] while the employment structure shows the characteristics of post-industrial economies. An estimated 63.2% of the employed workforce work in the service sector, industry contributed by 29.7%, while agriculture employed 7.1%. The unemployment rate was 3.8% in September–November 2017,[34] down from 11% during the financial crisis of 2007–08. Hungary is part of the European Single Market which represents more than 448 million consumers. Several domestic commercial policies are determined by agreements among European Union members and by EU legislation.
Large Hungarian companies are included in the BUX, the Hungarian stock market index listed on Budapest Stock Exchange. Well-known companies include Graphisoft, Magyar Telekom, MKB Bank, MOL Group, Opus Global, OTP Bank, RÁBA Automotive Group, Gedeon Richter and Zwack Unicum. Hungary also has a large number of specialised small and medium enterprises, for example many automotive industry suppliers and technology start ups.[35]
Budapest is the financial and business capital of Hungary. The capital is a significant economic hub, classified as an Alpha- world city in the study by the Globalization and World Cities Research Network and it is the second fastest-developing urban economy in Europe. The per capita GDP in the city increased by 2.4% and employment by 4.7% compared to the previous year, 2014.[36][37] On the national level, Budapest is the primary city of Hungary for business, accounting for 39% of the national income. The city had a gross metropolitan product of more than $100 billion in 2015, making it one of the largest regional economies in the European Union.[38][39] Budapest is also among the Top 100 GDP performing cities in the world, as measured by PricewaterhouseCoopers. In a global city competitiveness ranking by the Economist Intelligence Unit, Budapest is ranked above Tel Aviv, Lisbon, Moscow and Johannesburg, among others.[40][41]
Hungary maintains its own currency, the Hungarian forint (HUF), although the economy fulfills the Maastricht criteria with the exception of public debt. The ratio of public debt to GDP is significantly below the EU average at 66.4% in 2019. The Hungarian National Bank was founded in 1924, after the dissolution of the Austro-Hungarian Empire. It is currently focusing on price stability, with an inflation target of 3%.[42]
History of the Hungarian economy edit
Árpád Age edit
In the age of feudalism the key economic factor was land. The new economic and social orders created private ownership of land. There are three forms of existence[clarification needed]: the royal, ecclesiastical and secular private estate. The royal estate of the Árpád dynasty had evolved from the tribal lands.[clarification needed]
The origin of the secular private holdings dates back to the conquest tribal common estates[clarification needed], which are increasingly in charge of the society and grows over private ownership of the becoming leaders.
However, from the founding of the state the royal gift also entered the multiplying factors secular private property line. This organization developed a feudal estate, which had two elements: the ancient estate and the possessions which were awarded by Saint Stephen I, and then the royal donations. Béla III was the wealthiest European monarch of his time, according to a list of his revenues, but the reliability of the list is questioned. Over the holder unrestricted right granted by the latter lineal heir almost returned to the king. In the Order of the laws changed in 1351, which abolished the nobility's possessions for free disposal. It forbidden the nobility to sale their inherited land.
The Carpathian Basin was more suitable for agriculture than large livestock grazing, and therefore increased steadily in the former weight. In the 11th and 12th centuries natural farming and soil changer tillage systems met: grazing the animals, and they used the fertilized land until depletion. The most important tools for the agriculture were the plow and the ox.
Anjou Age edit
Modern Age edit


The Hungarian economy prior to World War II was primarily oriented toward agriculture and small-scale manufacturing. Hungary's strategic position in Europe and its relative high lack of natural resources also have dictated a traditional reliance on foreign trade. For instance, its largest car manufacturer, Magomobil (maker of the Magosix), produced a total of a few thousand units.[43] In the early 1920s the textile industry began to expand rapidly, by 1928 it became the most important industry in the foreign trade of Hungary exporting textile goods worth more than 60 million pengős in that year. Companies like MÁVAG exported locomotives to India and South-America, its locomotive no. 601 was the largest and most powerful in Europe at the time.
Post-war Hungarian communism edit
From the late 1940s, the Communist government started to nationalize the industry. At first, only factories with more than 100 workers were nationalized; later, this limit was reduced to only 10. In the agriculture, the government started a successful program of collectivization. From the early 1950s, more and more new factories were built. This rapid and forced industrialization followed the standard Stalinist pattern in an effort to encourage a more self-sufficient economy. Most economic activity was conducted by state-owned enterprises or cooperatives and state farms. In 1968, Stalinist self-sufficiency was replaced by the "New Economic Mechanism", which reopened Hungary to foreign trade, gave limited freedom to the workings of the market, and allowed a limited number of small businesses to operate in the services sector.
Although Hungary enjoyed one of the most liberal and economically advanced economies of the former Eastern Bloc, both agriculture and industry began to suffer from a lack of investment in the 1970s, and Hungary's net foreign debt rose significantly—from $1 billion in 1973 to $15 billion in 1993—due largely to consumer subsidies and unprofitable state enterprises. In the face of economic stagnation, Hungary opted to liberalize further by passing a joint venture law, instating an income tax, and joining the International Monetary Fund (IMF) and the World Bank. By 1988, Hungary had developed a two-tier banking system, and had enacted significant corporate legislation that paved the way for the ambitious market-oriented reforms of the post-communist years.
Transition to a market economy (1990-1995) edit

After the fall of communism, the former Eastern Bloc had to transition from a one-party, centrally planned economy to a market economy with a multi-party political system. With the collapse of the Soviet Union, the Eastern Bloc countries suffered a significant loss in both markets for goods, and subsidizing from the Soviet Union.[44] Hungary, for example, "lost nearly 70% of its export markets in Eastern and Central Europe." The loss of external markets in Hungary left "800,000 unemployed people because all the unprofitable and unsalvageable factories had been closed."[45] Another form of Soviet subsidizing that greatly affected Hungary after the fall of communism was the loss of social welfare programs. Because of the lack of subsidies and a need to reduce expenditures, many social programs in Hungary had to be cut in an attempt to lower spending. As a result, many people in Hungary suffered incredible hardships during the transition to a market economy. Following privatization and tax reductions on Hungarian businesses, unemployment suddenly rose to 12% in 1991 (it was 1.7% in 1990 ), gradually decreasing until 2001. Economic growth, after a fall in 1991 to −11.9%, gradually grew until the end of the 1990s at an average annual rate of 4.2%. With the stabilization of the new market economy Hungary experienced growth in foreign investment,[46][47] with a "cumulative foreign direct investment totaling more than $60 billion since 1989."[48]
The Antall government of 1990–94 began market reforms with price and trade liberation measures, a revamped tax system, and a nascent market-based banking system. By 1994, however, the costs of government overspending and hesitant privatization had become clearly visible. Cuts in consumer subsidies led to increases in the price of food, medicine, transportation services, and energy. Reduced exports to the former Soviet bloc and shrinking industrial output contributed to a sharp decline in GDP. Unemployment rose rapidly to about 12% in 1993. The external debt burden, one of the highest in Europe, reached 250% of annual export earnings, while the budget and current account deficits approached 10% of GDP. The devaluation of the currency (in order to support exports), without effective stabilization measures, such as indexation of wages, provoked an extremely high inflation rate, that in 1991 reached 35% and slightly decreased until 1994, growing again in 1995. In March 1995, the government of Prime Minister Gyula Horn implemented an austerity program, coupled with aggressive privatization of state-owned enterprises and an export-promoting exchange raw regime, to reduce indebtedness, cut the current account deficit, and shrink public spending. By the end of 1997 the consolidated public sector deficit decreased to 4.6% of GDP—with public sector spending falling from 62% of GDP to below 50%—the current account deficit was reduced to 2% of GDP, and government debt was paid down to 94% of annual export earnings.[citation needed]
The Government of Hungary no longer requires IMF financial assistance and has repaid all of its debt to the fund. Consequently, Hungary enjoys favorable borrowing terms. Hungary's sovereign foreign currency debt issuance carries investment-grade ratings from all major credit-rating agencies, although recently the country was downgraded by Moody's, S&P and remains on negative outlook at Fitch. In 1995 Hungary's currency, the Forint (HUF), became convertible for all current account transactions, and subsequent to OECD membership in 1996, for almost all capital account transactions as well. Since 1995, Hungary has pegged the forint against a basket of currencies (in which the U.S. dollar is 30%), and the central rate against the basket is devalued at a preannounced rate, originally set at 0.8% per month, the Forint is now an entirely free-floating currency. The government privatization program ended on schedule in 1998: 80% of GDP is now produced by the private sector,[13] and foreign owners control 70% of financial institutions, 66% of industry, 90% of telecommunications, and 50% of the trading sector.[citation needed]
After Hungary's GDP declined about 18% from 1990 to 1993 and grew only 1%–1.5% up to 1996, strong export performance propelled GDP growth to 4.4% in 1997, with other macroeconomic indicators similarly improving. These successes allowed the government to concentrate in 1996 and 1997 on major structural reforms such as the implementation of a fully funded pension system (partly modelled after Chile's pension system with major modifications), reform of higher education, and the creation of a national treasury. Remaining economic challenges include reducing fiscal deficits and inflation, maintaining stable external balances, and completing structural reforms of the tax system, health care, and local government financing. Recently, the overriding goal of Hungarian economic policy has been to prepare the country for entry into the European Union, which it joined in late 2004.
Prior to the change of regime in 1989, 65% of Hungary's trade was with Comecon countries. By the end of 1997, Hungary had shifted much of its trade to the West. Trade with EU countries now comprises 80% of the total.[49] Germany is Hungary's single most important trading partner. The US has become Hungary's sixth-largest export market, while Hungary is ranked as the 72nd largest export market for the U.S. Bilateral trade between the two countries increased 46% in 1997 to more than $1 billion. The U.S. has extended to Hungary most-favored-nation status, the Generalized System of Preferences, Overseas Private Investment Corporation insurance, and access to the Export-Import Bank.[citation needed]
With about $18 billion in foreign direct investment (FDI) since 1989, Hungary has attracted over one-third of all FDI in central and eastern Europe, including the former Soviet Union. Of this, about $6 billion came from American companies. Foreign capital is attracted by skilled and relatively inexpensive labor, tax incentives, modern infrastructure, and a good telecommunications system.[citation needed]
By 2006 Hungary's economic outlook had deteriorated. Wage growth had kept up with other nations in the region; however, this growth has largely been driven by increased government spending. This resulted in the budget deficit ballooning to over 10% of GDP and inflation rates predicted to exceed 6%. Nouriel Roubini, an economist in the Clinton administration, said that "Hungary is an accident waiting to happen."[50]
Privatization in Hungary edit
In January 1990, the State Privatization Agency (SPA, Állami Vagyonügynökség) was established to manage the first steps of privatization. Because of Hungary's $21.2 billion foreign debt, the government decided to sell state property instead of distributing it to the people for free.[51] The SPA was attacked by populist groups because several companies' management had the right to find buyers and discuss sale terms with them thus "stealing" the company. Another reason for discontent was that the state offered large tax subsidies and environmental investments, which sometimes cost more than the selling price of the company. Along with the acquisition of companies, foreign investors launched many "greenfield investments".[51]
The center-right Hungarian Democratic Forum government of 1990–1994 decided to abolish agricultural co-operatives by splitting them up and giving machinery and land to their former members.[52] The government also introduced a Recompensation Law which offered vouchers to people who had owned land before it was nationalized in 1948. These people (or their descendants) could exchange their vouchers for land previously owned by agricultural co-operatives, who were forced to give up some of their land for this purpose.[52]
Small stores and retail businesses were privatized between 1990 and 1994, however, greenfield investments by foreign retail companies like Tesco, Cora and IKEA had a much bigger economic impact.[51] Many public utilities, including the national telecommunications company Matáv, the national oil and gas conglomerate MOL Group, and electricity supply and production company MVM Group were privatized as well.[53]
Though most banks were sold to foreign investors, the largest bank, National Savings Bank (OTP), remained Hungarian-owned. 20%–20% of the shares were sold to foreign institutional investors and given to the Social Security organizations, 5% were bought by employees, and 8% was offered at the Budapest Stock Exchange.[54]
Hungary's economy since 1995 edit


Reaching 1995, Hungary's fiscal indices deteriorated: foreign investment fell as well as judgement of foreign analysts on economic outlook.[55] Due to high demand in import goods, Hungary also had a high trade deficit[56] and budget gap, and it could not reach an agreement with the IMF, either.[55][57] After not having a minister of finance for more than a month, prime minister Gyula Horn appointed Lajos Bokros as Finance Minister on 1 March 1995. He introduced a string of austerity measures (the "Bokros Package") on 12 March 1995 which had the following key points: one-time 9% devaluation of the forint, introducing a constant sliding devaluation, 8% additional customs duty on all goods except for energy sources, limitation of growth of wages in the public sector, simplified and accelerated privatization. The package also included welfare cutbacks, including abolition of free higher education and dental service; reduced family allowances, child-care benefits, and maternity payments depending on income and wealth; lowering subsidies of pharmaceuticals, and raising retirement age.
These reforms not only increased investor confidence,[58] but they were also supported by the IMF and the World Bank,[59] however, they were not welcome widely by the Hungarians; Bokros broke the negative record of popularity: 9% of the population wanted to see him in an "important political position"[60] and only 4% were convinced that the reforms would "improve the country's finances in a big way"[55]
In 1996, the Ministry of Finance introduced a new pension system instead of the fully state-backed one: private pension savings accounts were introduced, which were 50% social security based and 50% funded.[59]
In 2006 Prime Minister Ferenc Gyurcsány was reelected on a platform promising economic "reform without austerity". However, after the elections in April 2006, the Socialist coalition under Gyurcsány unveiled a package of austerity measures which were designed to reduce the budget deficit to 3% of GDP by 2008.[61]
Because of the austerity program, the economy of Hungary slowed down in 2007.[61]
2008–2009 financial crisis edit
Declining exports, reduced domestic consumption and fixed asset accumulation hit Hungary hard during the financial crisis of 2008, making the country enter a severe recession of −6.4%, one of the worst economic contractions in its history.
On 27 October 2008, Hungary reached an agreement with the IMF and EU for a rescue package of US$25 billion, aiming to restore financial stability and investors' confidence.[62]
Because of the uncertainty of the crisis, banks gave less loans which led to a decrease in investment. This along with price-awareness and fear of bankruptcy led to a fallback in consumption which then increased job losses and decreased consumption even further. Inflation did not rise significantly, but real wages decreased.[63]
The fact that the euro and the Swiss franc are worth a lot more in forints than they were before affected a lot of people. According to The Daily Telegraph, "statistics show that more than 60 percent of Hungarian mortgages and car loans are denominated in foreign currencies".[64] After the election in 2010 of the new Fidesz-party government of Prime Minister Viktor Orbán, Hungarian banks were forced to allow the conversion of foreign-currency mortgages to the forint.[65] The new government also nationalized $13 billion of private pension-fund assets, which could then be used to support the government debt position.[66]
Post 2008 recession Hungarian economy edit
The economy showed signs of recovery in 2011 with decreasing tax rates and a moderate 1.7 percent GDP growth.[67]
From November 2011 to January 2012, all three major credit rating agencies downgraded Hungarian debt to a non-investment speculative grade, commonly called "junk status".[68][69][70] In part this is because of political changes creating doubts about the independence of the Hungarian National Bank.[71][68][69]
European Commission President José Manuel Barroso wrote to Prime Minister Viktor Orbán stating that new central bank regulations, allowing political intervention, "seriously harm" Hungary's interests, postponing talks on a financial aid package. Orbán responded "If we don't reach an agreement, we'll still stand on our own feet."[65]
The European Commission launched legal proceedings against Hungary on 17 January 2012. The procedures concern Hungary's central bank law, the retirement age for judges and prosecutors and the independence of the data protection office, respectively.[72][73] One day later Orbán indicated in a letter his willingness to find solutions to the problems raised in the infringement proceedings.[74] On 18 January he participated in plenary session of the European Parliament which also dealt with the Hungarian case. He said "Hungary has been renewed and reorganised under European principles". He also said that the problems raised by the European Union can be resolved "easily, simply and very quickly". He added that none of the EC's objections affected Hungary's new constitution.[75][76]
Following the mild recession of 2012, the GDP picked up again from 2014, and based on the commission's Winter 2015 forecast it was projected to have accelerated to 3.3%. The more dynamic economic performance attributed to a moderately growing domestic demand and supported the growth of gross fixed capital formation. The surge (3.8% in the first half of 2014), however was only achieved via temporary measures and factors, such as the stepped-up absorption of EU-funds and the central bank's Funding for Growth Scheme, which subsidised loans for small-and medium-sized enterprises.[77] The fundaments of growth didn't considerably change in 2015 as well – the government supported EU-fund transfers along with the moderately successful central bank loans of economic revitalization – fueled the fair GDP growth.
Hungarian economy during and after the covid pandemic edit
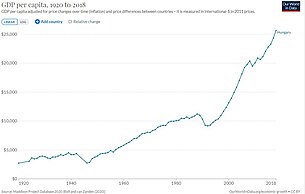
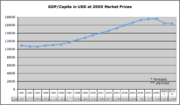
The Hungarian GDP, GDP per capita, living standards and wages have been steadily rising until the start of the Covid-19 pandemic, when just like the rest of Europe, the stats above tanked. GDP fell to $155 Billion, GDP PPP has fallen to $322 Billion, GDP per capita to $15,855, inflation slightly rose to 4.54%.
National debt rose considerably, to around 80% Debt-to-GDP from the previous 60–65%.
The country was hard hit, unemployment was also higher than average until 2021 when after the lockdowns have stopped. The GDP, GDP per capita, GDP PPP, unemployment and national debt have all recovered to and beyond their pre-covid values.[citation needed] On the other hand, inflation has risen to the record levels, reaching 24.5% in December 2022, being the highest in Europe.[78]
Physical properties edit
Natural resources edit
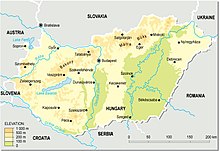
Hungary's total land area is 93,030 km2 along with 690 km2 of water surface area which altogether makes up 1% of Europe's area.
Nearly 75% of Hungary's landscape consists of flat plains. Additional 20% of the country's area consists of foothills whose altitude is 400 m at the most; higher hills and water surface makes up the remaining 5%.
The two flat plains that take up three-quarters of Hungary's area are the Great Hungarian Plain and the Little Hungarian Plain. Hungary's most significant natural resource is arable land. About 83% of the country's total territory is suitable for cultivation;[79] of this portion, 75% (around 50% of the country's area) is covered by arable land, which is an outstanding ratio compared to other EU countries.[79] Hungary lacks extensive domestic sources of energy and raw materials needed for further industrial development.
19% of the country is covered by forests. These are located mainly in the foothills such as the North Hungarian and the Transdanubian Mountains, and the Alpokalja. The composition of forests is various; mostly oak or beech, but the rest include fir, willow, acacia and plane.

In European terms, Hungary's underground water reserve is one of the largest. Hence the country is rich in brooks and hot springs as well as medicinal springs and spas; as of 2003, there are 1250 springs that provide water warmer than 30 °C.[80] 90% of Hungary's drinking water is mostly retrieved from such sources.[81]
The major rivers of Hungary are the Danube and the Tisza. The Danube also flows through parts of Germany, Austria, Slovakia, Serbia, and Romania. It is navigable within Hungary for 418 km. The Tisza River is navigable for 444 km in the country. Hungary has three major lakes. Lake Balaton, the largest, is 78 km long and from 3 to 14 km wide, with an area of 592 km2. Lake Balaton is Central Europe's largest lake and a prosperous tourist spot and recreation area. Its shallow waters offer summer bathing and during the winter its frozen surface provides facilities for winter sports. Smaller bodies of water include Lake Velence (26 km2) in Fejér County and Lake Fertő (82 km2 within Hungary).
The waters of the country are in danger, since more water is going out of the county than in. In 2022, a severe drought which has impacted all of Europe is endangering among others, Lake Velence, Lake Balaton, the Danube and Tisza rivers. The flow of the aforementioned rivers have been modified in the late 19th century, and while it prevented larger floods and helped water transport, it has its downsides, such as the inability to support large-scale watering of crops, worsening the drought of 2022. Large-scale reforms and rebuilding of the Alföld water system is needed, but no such plans are being announced by the government as of 2022.
Infrastructure edit
Transport edit

Hungary has 31,058 km of roads and motorways of 1,118 km. The total length of motorways has doubled in the last ten years with the most (106) kilometers built in 2006. Budapest is directly connected to the Austrian, Slovakian, Slovenian, Croatian, Romanian and Serbian borders via motorways.
Due to its location and geographical features, several transport corridors cross Hungary. Pan-European corridors no. IV, V, and X, and European routes no. E60, E71, E73, E75, and E77 go through Hungary. Thanks to its radial road system, all of these routes touch Budapest.

There are five international, four domestic, four military and several non-public airports in Hungary. The largest airport is the Budapest Ferihegy International Airport (BUD) located at the southeastern border of Budapest. In 2008, the airport had 3,866,452 arriving and 3,970,951 departing passengers.[82]
In 2006, the Hungarian railroad system was 7,685 km long, 2,791 km of it electrified.
Public utilities edit
Electricity is available in every settlement in Hungary.
Piped gas is available in 2873 settlements, 91.1% of all of them.[83] To avoid gas shortages due to Ukrainian pipeline shutdowns like the one in January 2009,[84] Hungary participates both in the Nabucco and the South Stream gas pipeline projects. Hungary also has strategical gas reserves: the latest reserve of 1.2 billion cubic meters was opened in October 2009.[85]
In 2008, 94.9% of households had running water.[86] Though it is the responsibility of municipal governments to provide people with healthy water supply,[87] the Hungarian government and the European Union offer subsidies to those who wish to develop water supplies or sewage systems.[88] Partly because of these subsidies, 71.3% of all dwellings are connected to the sewage system, up from 50,1% in 2000.[89]
Internet penetration has been rising significantly over the past few years: the ratio of households having an internet connection has risen from 22.1% (49% of which was broadband) in 2005 to 48.4% (87.3% of which was broadband) in 2008.[90]
The Ministry of Economy and Transport introduced the eHungary program in 2004 aiming to provide every person in Hungary with internet access by setting up "eHungary points" in public spaces like libraries, schools and cultural centers.[91] The program also includes "the introduction of the eCounsellor network – a service through which professionals provide assistance for citizens in the effective usage of electronic information, services and knowledge".[92]
Sectors edit
In 2022, the sector with the highest number of companies registered in Hungary is Services with 273,851 companies followed by Finance, Insurance, and Real Estate and Retail Trade with 113,153 and 87,237 companies respectively.[93]
Agriculture edit

Agriculture accounted for 4.3% of GDP in 2008[94] and along with the food industry occupied roughly 7.7% of the labor force.[95] These two figures represent only the primary agricultural production: along with related businesses, agriculture makes up about 13% of the GDP.[79] Hungarian agriculture is virtually self-sufficient and due to traditional reasons export-oriented:[79] exports related to agriculture make up 20–25% of the total. About half of Hungary's total land area is agricultural area under cultivation; this ratio is prominent among other EU members.[79] This is due to the country's favorable conditions including continental climate and the plains that make up about half of Hungary's landscape. The most important crops are wheat, corn, sunflower, potato, sugar beet, canola and a wide variety of fruits (notably apple, peach, pear, grape, watermelon, plum etc.). Hungary has several wine regions producing among others the worldwide famous white dessert wine Tokaji and the red Bull's Blood. Another traditional world-famous alcoholic drink is the fruit brandy pálinka.
Mainly cattle, pigs, poultry and sheep are raised in the country. The livestock includes the Hungarian Grey Cattle which is a major tourist attraction in the Hortobágy National Park. An important component of the country's gastronomic heritage is foie gras with about 33,000 farmers engaged in the industry. Hungary is the second largest world producer and the biggest exporter of foie gras (exporting mainly to France).
Another symbol of Hungarian agriculture and cuisine is the paprika (both sweet and hot types). The country is one of the leading paprika producers of the world with Szeged and Kalocsa being the centres of production.
Hungary produced, in 2018, 7.9 million tons of maize (15th largest producer in the world); 5.2 million tons of wheat; 1.8 million tons of sunflower seed (8th largest producer in the world); 1.1 million tons of barley; 1 million tons of rapeseed (14th largest producer in the world); 941 thousand tons of sugar beet, which is used to produce sugar and ethanol; 674 thousand tons of apple; 539 thousand tons of grape; 330 thousand tons of potato; 330 thousand tons of triticale; in addition to smaller productions of other agricultural products.[96]
Health care edit

Hungary has a tax-funded universal healthcare system, organized by the state-owned National Healthcare Fund (Hungarian: Országos Egészségbiztosítási Pénztár (OEP)). Health insurance is not directly paid for by children, mothers or fathers with baby, students, pensioners, people with socially poor background, handicapped people (including physical and mental disorders),[97] priests and other church employees.[98] Health in Hungary can be described with a rapidly growing life expectancy and a very low infant mortality rate (4.9 per 1,000 live births in 2012).[99] Hungary spent 7.4% of the GDP on health care in 2009 (it was 7.0% in 2000), lower than the average of the OECD. Total health expenditure was 1,511 US$ per capita in 2009, 1,053 US$ governmental-fund (69.7%) and 458 US$ private-fund (30.3%)[100] but has now risen to 2047 US$ per capita (as per 2018 data), roughly a 33% increase total, with the government funding 1439 US$ (70.3%) of the total versus the private funding 608 US$ (29.7%).[101] This amount totals to 6.6% of the country's total GDP, roughly a percent decrease overall.[102]
Industry edit
The main sectors of Hungarian industry are heavy industry (mining, metallurgy, machine and steel production), energy production, mechanical engineering, chemicals, food industry and automobile production. The industry is leaning mainly on processing industry and (including construction) accounted for 29.32% of GDP in 2008.[103] Due to the sparse energy and raw material resources, Hungary is forced to import most of these materials to satisfy the demands of the industry. Following the transition to market economy, the industry underwent restructuring and remarkable modernization. The leading industry is machinery, followed by chemical industry (plastic production, pharmaceuticals), while mining, metallurgy and textile industry seemed to be losing importance in the past two decades. In spite of the significant drop in the last decade, food industry is still giving up to 14% of total industrial production and amounts to 7–8% of the country's exports.[104]
Nearly 50% of energy consumption is dependent on imported energy sources. Gas and oil are transported through pipelines from Russia forming 72% of the energy structure, while nuclear power produced by the nuclear power station of Paks accounts for 53,6%.
Automobile production edit

Hungary is a favoured destination of foreign investors of automotive industry resulting in the presence of General Motors (Szentgotthárd), Magyar Suzuki (Esztergom), Mercedes-Benz (Kecskemét), and Audi factory (Győr) in Central Europe.

17% of the total Hungarian exports comes from the exports of Audi, Opel and Suzuki. The sector employs about 90,000 people in more than 350 car component manufacturing companies.[106]
Audi has built the largest engine manufacturing plant of Europe (third largest in the world) in Győr becoming Hungary's largest exporter with total investments reaching over €3,300 million until 2007.[107] Audi's workforce assembles the Audi TT, the Audi TT Roadster and the A3 Cabriolet in Hungary.[107] The plant delivers engines to carmakers Volkswagen, Skoda, Seat and also to Lamborghini.[107]
Daimler-Benz invests €800 million ($1.2 billion) and creates up to 2,500 jobs at a new assembly plant in Kecskemét, Hungary[108] with capacity for producing 100,000 Mercedes-Benz compact cars a year.[109]
Opel produced 80,000 Astra and 4,000 Vectra cars from March 1992 until 1998 in Szentgotthárd, Hungary.[110] Today, the plant produces about half million engines and cylinder heads a year.[110]
Services edit
The tertiary sector accounted for 64% of GDP in 2007 and its role in the Hungarian economy is steadily growing due to constant investments into transport and other services in the last 15 years. Located in the heart of Central-Europe, Hungary's geostrategic location plays a significant role in the rise of the service sector as the country's central position makes it suitable and rewarding to invest.
The total value of imports was 68.62 billion euros, the value of exports was 68.18 billion euros in 2007. The external trade deficit decreased by 12.5% since the previous year, easing down from 2.4 billion to 308 million euros in 2007. In the same year, 79% of Hungary's export and 70% of the imports were transacted inside the EU.[111]
Tourism edit

Tourism employs nearly 150 thousand people and the total income from tourism was 4 billion euros in 2008.[112] One of Hungary's top tourist destinations is Lake Balaton, the largest freshwater lake in Central Europe, with a number of 1.2 million visitors in 2008. The most visited region is Budapest, the Hungarian capital attracted 3.61 million visitors in 2008.
Hungary was the world's 24th most visited country in 2011.[113] The Hungarian spa culture is world-famous, with thermal baths of all sorts and over 50 spa hotels located in many towns, each of which offer the opportunity of a pleasant, relaxing holiday and a wide range of quality medical and beauty treatments.
Currency edit
The currency of Hungary is the Hungarian forint (HUF, Ft) since 1 August 1946. A forint consists of 100 fillérs; however, since these have not been in circulation since 1999, they are only used in accounting.
There are six coins (5, 10, 20, 50, 100, 200)[114] and six banknotes (500, 1000, 2000, 5000, 10,000 and 20,000).[115] The 1 and 2 Forint coins were withdrawn in 2008, yet prices remained the same as stores follow the official rounding scheme[116] for the final price. The 200 Forint note was withdrawn on 16 November 2009.[117]
The fulfillment of the Maastricht criteria edit
| Convergence criteria | Obligation to adopt 4 | Target date | Euro coins design | ||||||
|---|---|---|---|---|---|---|---|---|---|
| Country 1 | Inflation rate² | Government finances | ERM II membership | Interest rate ³ | set by the country | recommended by the Commission | |||
| annual government deficit to GDP | gross government debt to GDP | ||||||||
| Reference value 5 | max 3.2% | max. 3% | max. 60% | min. 2 years | max 6.5% | N/A | N/A | N/A | N/A |
| 2.7%
(as of Dec 2020)[118] |
2.0%
(fiscal year 2019)[119] |
66.3%[120] | 0 years | 0.60% | yes | 2019–2020 | N/A | in progress | |
1 Current EU member states that have not yet adopted the Euro, candidates and official potential candidates.
² No more than 1.5% higher than the 3 best-performing EU member states.
³ No more than 2% higher than the 3 best-performing EU member states.
4 Formal obligation for Euro adoption in the country EU Treaty of Accession or the Framework for membership negotiations.
5 Values from May 2008 report.[122] To be updated each year.
Socioeconomic characteristics edit
Human capital edit

Education in Hungary is free and compulsory from the age of 5 to 16.[123] The state provides free pre-primary schooling for all children, 8 years of general education and 4 years of upper secondary level general or vocational education.[123] Higher education system follows the three-cycle structure and the credit system of the bologna process.[123] Governments aim to reach European standards and encourage international mobility by putting emphasis on digital literacy, and enhancing foreign language studies: all secondary level schools teach foreign languages and at least one language certificate is needed for the acquisition of a diploma.[123] Over the past decade, this resulted in a drastic increase in the number of people speaking at least one foreign language.[124]
Hungary's most prestigious universities are:
- Semmelweis University with five schools (medical school, dentistry, pharmacy, nursing and physical education).
- Eötvös Loránd University (Eötvos Loránd Tudományegyetem, or ELTE, which is among the top 500 universities in the world[125])
- Budapest University of Technology and Economics (Budapesti Műszaki és Gazdaságtudományi Egyetem, or BME) BME is considered the oldest Institutes of Technology of university rank and structure in the world. Established 1782.
- Corvinus University of Budapest (Budapesti Corvinus Egyetem, or BCE)
- Central European University (Közép-európai Egyetem, or CEU)
- University of Pécs (Pécsi Tudományegyetem, or PTE)
- University of Miskolc (Miskolci Egyetem or ME)
- University of Szeged (Szegedi Tudományegyetem or SZTE) In 2010, the QS World University Rankings put the University of Szeged as 451st–500th among universities globally.
- University of Debrecen (Debreceni Egyetem or DE)
Financial sources for education are mainly provided by the state (making up 5.1–5.3% of the annual GDP).[123] In order to improve the quality of higher education, the government encourages contributions by students and companies. Another important contributor is the EU.[123]

The system has weaknesses, the most important being segregation and unequal access to quality education.[123] The 2006 PISA report concluded that while students from comprehensive schools did better than the OECD average, pupils from vocational secondary schools did much worse.[126] Another problem is of the higher education's: response to regional and labour market needs is insufficient.[123] Government plans include improving the career guidance system and establishing a national digital network that will enable the tracking of jobs and facilitate the integration into the labour market.[123]
Social stratification edit
As most post-communist countries, Hungary's economy is affected by its social stratification in terms of income and wealth, age, gender and racial inequalities.[127]

Hungary's Gini coefficient of 0.269[128] ranks 11th in the world.[129] The graph on the right shows that Hungary is close in equality to the world-leader Denmark. The highest 10% of the population gets 22.2% of the incomes.[128] According to the business magazine Napi Gazdaság, the owner of the biggest fortune, 300 billion HUF, is Sándor Demján.[130] On the other hand, the lowest 10% gets 4% of the incomes. Considering the standard EU indicators (Percentage of the population living under 60% of the per capita median income), 13% of the Hungarian population is stricken by poverty.[131] According to the Human Development Report, the country's HPI-1 value is 2.2% (3rd among 135 countries),[132] and its HDI value is 0.879 (43rd out of 182).[132]

The fertility rate in Hungary, just like in many European countries, is very low: 1.34 children/women (205th in the world)[133] Life expectancy at birth is 73.3 years.,[133] while the expected number of healthy years is 57.6 for females and 53.5 for males. The average life expectancy overall is 73.1 years.[134]
Hungary's GDI (gender-related development index) value of 0.879[132] is 100% of its HDI value (3rd best in the world).[132] 55.5% of the female population (between 15 and 64) participate in the labour force, and the ratio of girls to boys in primary and secondary education is 99%.[133]
Ethnic inequality, which strikes primarily Roma in Hungary, is a serious problem. Although the definition of the Roma identity is controversial,[135] qualitative studies prove that the Roma employment rate decreased significantly following the fall of Communism:[136] due to the tremendous layoffs of unskilled workers[137] during the transition years, more than one-third of Roma were excluded from the labour market.[138] Therefore, this ethnic conflict is inherently interconnected with the income inequalities in the country[139] – at least two-thirds of the poorest 300,000 people in Hungary are Romas.[139] Furthermore, ethnic discrimination is outstandingly high, 32% of Romas experience discrimination when looking for work.[140] Consequently, new Roma entrants to the labour market are rarely able to find employment,[138] which creates a motivation deficit and further reinforces segregation and unemployment.[141]
Institutional quality edit
Twenty years after the change of the regime, corruption remains a severe issue in Hungary.[142] According to Transparency International Hungary, almost one-third of top managers claim they regularly bribe politicians.[142] Most people (42%) in Hungary think that the sector most affected by bribery is the political party system.[143] Bribery is common in the healthcare system in the form of gratitude payment–92% of all people think that some payment should be made to the head surgeon conducting a heart operation or an obstetrician for a child birth.[144]
Another problem is the administrative burden: in terms of the ease of doing business, Hungary ranks 47th out of 183 countries in the world.[145] The five days' time[133] required to start a new business ranks 29th, and the country is 122nd concerning the ease of paying taxes.[146]
In accordance with the theory of the separation of powers, the judicial system is independent from the legislative and the executive branches.[147] Consequently, courts and prosecutions are not influenced by the government. However, the legal system is slow and overburdened, which makes proceedings and rulings lengthy and inefficient.[148] Such a justice system is hardly capable of prosecuting corruption and protecting the country's financial interests.[142]
Unemployment in Hungary edit
State participation edit
Monetary policy edit
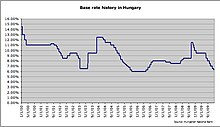
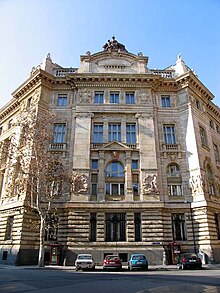
The Hungarian organization responsible for controlling the country's monetary policy is the Hungarian National Bank (Hungarian: Magyar Nemzeti Bank, MNB) which is the central bank in Hungary.[149] According to the Hungarian Law of National Bank (which became operative in 2001. – LVIII. Law about The Hungarian National Bank[150]), the primary objective of MNB is to achieve and maintain price stability. This aim is in line with the European and international practice.
Price stability means achieving and maintaining a basically low, but positive inflation rate. This level is around 2–2.5% according to international observations, while the European Central Bank "aims at inflation rates of below, but close to 2% over the medium term".[151] Since Hungary is in the process of catching up (Balassa-Samuelson effect), the long-term objective is a slightly higher figure, around 2.3–3.2%.[152] Therefore, the medium term inflation target of the Hungarian National Bank is 3%.[153]
Concerning the exchange rate system, the floating exchange rate system is in use since 26 February 2008, as a result of which HUF is fluctuating in accordance with the effects of the market in the face of the reference currency, the euro.

The chart on the right shows forint exchange rates for the British pound (GBP), euro (EUR), Swiss franc (CHF), and the U.S. dollar (USD) from June 2008 to September 2009. It indicates that a relatively strong forint weakened since the beginning of the financial crisis, and that its value has recently taken an upward turn.
Compared to the euro the forint was at peak on 18 June 2008 when 1000 Ft was €4.36 and €1 was 229.11Ft. The forint was worth the least on 6 March 2009; this day 1000 Ft was €3.16 and €1 was 316Ft).
Compared to USD, most expensive/cheapest dates are 22 June 2008 and 6 March 2009 with 1000HUF/USD rates 6.94 and 4.01 respectively.
On 24 March 2015 the Euro was at 299.1450 and USD was at 274.1650,
Fiscal policy edit

In Hungary, state revenue makes up 44% and expenditure makes up 45% of the GDP which is relatively high compared to other EU members.[154] This can be traced back to historical reasons such as socialist economic tradition as well as cultural characteristics that endorse paternalist behaviour on the state's part, meaning that people have a habitual reflex that make them call for state subsidies.[155] Some economists[who?] dispute this point, claiming that expenditure ran up to today's critical amount from 2001, during two left-wing government cycles.[154]
Along with joining the EU the country undertook the task of joining the Eurozone as well. Therefore, the Maastricht criteria which forms the condition of joining the Eurozone acts as an authoritative guideline to Hungarian fiscal politics. Although there has been remarkable progress, recent years' statistics still point at significant discrepancies between the criteria and fiscal indices. The target date for adapting the Euro has not been fixed, either.
General government deficit has shown a drastic decline to −3.4% (2008) from −9.2% (2006).[156] According to an MNB forecast however, until 2011, the deficit will by a small margin fall short of the 3.0% criterion.[157]
Another criterion that is found lacking is the ratio of gross government debt to GDP which, since 2005, exceeds the allowed 60%.[158] According to an ESA95 figure, in 2008 the ratio increased from 65.67% to 72.61%, which primarily results from the requisition of an IMF-arranged financial assistance package.[159]
Hungary's balance of payments on its current account has been negative since 1995, around 6–8% in the 2000s[160] reaching a negative peak 8.5% in 2008.[160] Still, current account deficit will expectedly decrease in the following period, as imports will diminish compared to exports as an effect of the financial crisis.[161]
Tax system edit
In Hungary, the 1988 reform of taxes introduced a comprehensive tax system which mainly consists of central and local taxes, including a personal income tax, a corporate income tax and a value added tax.[162] Among the total tax income the ratio of local taxes is solely 5% while the EU average is 30%.[163] Until 2010, the taxation of an individual was progressive, determining the tax rate based on the individual's income: with earning up to 1,900,000 forints a year, the tax was 18%, the tax on incomes above this limit was 36% since 1 July 2009.[164]
Based on the new one-rate tax regime introduced January 2011, the overall tax rate for all income-earnings bands has been 16%. According to the income-tax returns of 2008, 14,6% of taxpayers was charged for 64,5% of the total tax burdens.[165] Before the new corporate income tax regime, the corporate tax was fixed at 16% of the positive rateable value, with an additional tax called solidarity tax of 4%, the measure of which is calculated based on the result before tax of the company (the solidarity tax has been in use since September, 2006). The actual rateable value might be different is the two cases. From January 2011, under the new corporate income tax regime the tax rate was divided into two parts (i) corporations having income before tax below 500 million HUF (appr. USD 2.5 million) was lowered to 10% and (ii) 16% remained for all other companies until 2013. After this, the unified corporate income tax rate will be 10%, irrespectively from the size of the net income before tax. In January 2017, corporate tax was unified at a rate of 9% – the lowest in the European Union. The rate of value added tax in Hungary is 27%, the highest in Europe, since 1 January 2012.[166]
Miscellaneous data edit
The following table shows the main economic indicators in 1980–2021. Inflation under 2% is in green.[167]
| Year | GDP (in Bil. US$ PPP) |
GDP per capita (in US$ PPP) |
GDP
(in US$ nominal) |
GDP growth (real) |
Inflation rate (in Percent) |
Unemployment (in Percent) |
Government debt (in % of GDP) |
|---|---|---|---|---|---|---|---|
| 1980 | 68.3 | 6,376 | 23.0 | 0.6% | n/a | ||
| 1981 | n/a | ||||||
| 1982 | n/a | ||||||
| 1983 | n/a | ||||||
| 1984 | n/a | ||||||
| 1985 | n/a | ||||||
| 1986 | n/a | ||||||
| 1987 | n/a | ||||||
| 1988 | n/a | ||||||
| 1989 | n/a | ||||||
| 1990 | n/a | ||||||
| 1991 | n/a | ||||||
| 1992 | n/a | ||||||
| 1993 | n/a | ||||||
| 1994 | n/a | ||||||
| 1995 | 84.1% | ||||||
| 1996 | |||||||
| 1997 | |||||||
| 1998 | |||||||
| 1999 | |||||||
| 2000 | |||||||
| 2001 | |||||||
| 2002 | |||||||
| 2003 | |||||||
| 2004 | |||||||
| 2005 | |||||||
| 2006 | |||||||
| 2007 | |||||||
| 2008 | |||||||
| 2009 | |||||||
| 2010 | |||||||
| 2011 | |||||||
| 2012 | |||||||
| 2013 | |||||||
| 2014 | |||||||
| 2015 | |||||||
| 2016 | |||||||
| 2017 | |||||||
| 2018 | |||||||
| 2019 | |||||||
| 2020 | |||||||
| 2021 |
Households with access to fixed and mobile telephony Quick facts – Telecommunication market in Hungary – Hungarian Statistical office (3Q 2011) [permanent dead link]
- number of households – 4,001,976 (October 2011)
- number of landline telephones – 2,884,000 (October 2011)
- landline telephones / households – 72.1% (October 2011)
- landline telephones / inhabitants – 28.9% (October 2011)
- number of mobile telephone subscriptions – 11,669,000 (October 2011)
- mobile telephone subscriptions / inhabitants (Mobile telephone penetration) – 117.1% (December 2011)
Broadband penetration rate
- number of fixed broadband – 2,111,967 (October 2011)
- number of mobile broadband – 1,872,178 (October 2011)
- fixed broadband per households – 52.8% (December 2011)
- mobile broadband per households – 43.4% (January 2012)
Individuals using computer and internet[168]
- computer – 65% (2009)
- internet – 62% (2009)
External relations edit
Hungary joined the European Union on 05/01/2004 after a successful referendum[169] among the EU-10. The EU's free trade system helps Hungary, as it is a relatively small country and thus needs export and import.
After the accession to the EU, Hungarian workers could immediately go to work to Ireland, Sweden and the United Kingdom. Other countries imposed restrictions.[170]
In 2007, 25% of all exports of Hungary were of high technology, which is the 5th largest ratio in the European Union after Malta, Cyprus, Ireland, and the Netherlands. The EU10 average was 17.1% and the Eurozone average was 16% in 2007.[133]
See also edit
References edit
- ^ "World Economic Outlook Database, April 2023". IMF.org. International Monetary Fund. Retrieved 21 April 2023.
- ^ "World Bank Country and Lending Groups". datahelpdesk.worldbank.org. World Bank. Retrieved 29 September 2019.
- ^ "Hungary Population (2022) - Worldometer".
- ^ a b c d e "World Economic Outlook Database, October 2023". IMF.org. International Monetary Fund. 21 October 2023. Retrieved 21 October 2023.
- ^ a b c d e f g h "The World Factbook". Central Intelligence Agency. Retrieved 18 January 2019.
- ^ "Inflation rate of Hungary, 2024". European commission.
- ^ "EN". Mnb.hu. Retrieved 8 October 2017.
- ^ "Poverty headcount ratio at national poverty lines (% of population) – Hungary". data.worldbank.org. World Bank. Retrieved 2 December 2021.
- ^ "People at risk of poverty or social exclusion". ec.europa.eu. Eurostat. Retrieved 17 April 2020.
- ^ "Gini coefficient of equivalised disposable income – EU-SILC survey". ec.europa.eu/eurostat. Eurostat. Retrieved 28 November 2021.
- ^ "Human Development Index (HDI)". hdr.undp.org. HDRO (Human Development Report Office) United Nations Development Programme. Retrieved 11 October 2022.
- ^ "Inequality-adjusted HDI (IHDI)". hdr.undp.org. UNDP. Retrieved 11 October 2022.
- ^ a b c "Employment and activity by sex and age, age group 15–64". ec.europa.eu/eurostat. Eurostat. Retrieved 3 December 2021.
- ^ "About Hungary". Hungarian Investment Promotion Agency. Retrieved 23 May 2017.
- ^ "Unemployment by sex and age – monthly average". appsso.eurostat.ec.europa.eu. Eurostat. Retrieved 30 November 2021.
- ^ "Unemployment rate by age group". appsso.eurostat.ec.europa.eu. Eurostat. Retrieved 30 November 2021.
- ^ a b ".In January–December 2017 The value of exports amounted to EUR 100.6 billion (HUF 31,103 billion) and that of imports to EUR 92.5 billion (HUF 28,602 billion). EUR/USD was 1,25x100.6 and 92.5". Hungarian Central Statistical Office.
- ^ a b c d e f "Euro area and EU27 government deficit both at 0.6% of GDP" (PDF). ec.europa.eu/eurostat. Eurostat. Retrieved 28 April 2020.
- ^ "Archived copy" (PDF). Archived (PDF) from the original on 25 December 2017. Retrieved 25 December 2017.
{{cite web}}: CS1 maint: archived copy as title (link) - ^ "Archived copy" (PDF). Archived (PDF) from the original on 20 April 2017. Retrieved 25 December 2017.
{{cite web}}: CS1 maint: archived copy as title (link) - ^ "S&P upgrades Hungary in surprise gift to PM Orban". Reuters. 16 September 2016. Retrieved 13 January 2017.
- ^ "Moody's upgrades Hungary's government bond ratings to Baa3; stable outlook". 4 November 2016. Retrieved 13 January 2017.
- ^ "Fitch Upgrades Hungary to 'BBB'; Outlook Stable". 10 November 2017. Retrieved 23 January 2018.
- ^ "Scope affirms Hungary's credit ratings at BBB with Stable Outlook". 26 January 2024. Retrieved 27 January 2024.
- ^ "World Bank Country Classification". Retrieved 30 September 2014.
- ^ "Hungary". International Monetary Fund. Retrieved 6 September 2015.
- ^ "External trade surplus was EUR 604 million in December". Hungarian Central Statistical Office. 10 March 2016. Retrieved 10 March 2016.
- ^ "GDP – composition, by end use". CIA World Factbook. 2016. Archived from the original on 12 February 2018. Retrieved 11 March 2016.
- ^ "Hungary". CIA World Factbook. 2016. Retrieved 11 March 2016.
- ^ "Export Partners of Hungary". CIA World Factbook. 2016. Archived from the original on 12 February 2018. Retrieved 11 March 2016.
- ^ Tourism Highlights 2015 Edition. World Tourism Organization. 10 March 2016. doi:10.18111/9789284416899. ISBN 9789284416899.
- ^ "Electronics". HIPA. Archived from the original on 15 March 2016. Retrieved 11 March 2016.
- ^ "In the period of July–September 2017, the average number of employed people was 4,451 thousand, 60 thousand more than a year earlier. The employment rate of people aged 15–64 increased to 68.7%". KSH. Retrieved 26 October 2017.
- ^ "In the period of September–November 2017, the average number of unemployed people was 178 thousand, 30 thousand fewer than a year earlier, and the unemployment rate decreased by 0.7 percentage point to 3.8%". Hungarian Central Statistical Office. Retrieved 4 January 2018.
- ^ "Top – Hungary". startupRANKING. Retrieved 10 March 2016.
- ^ "BUDAPEST EUROPE'S SECOND FASTEST-DEVELOPING URBAN ECONOMY, STUDY REVEALS – The study examines the development of the world's 300 largest urban economies, ranking them according to the pace of development". Brookings Institution. 23 January 2015. Archived from the original on 10 October 2017. Retrieved 8 March 2016.
- ^ "The World According to GaWC 2010". lboro.ac.uk. 13 April 2010. Retrieved 12 May 2014.
- ^ Istrate, Emilia. "Global MetroMonitor | Brookings Institution". Brookings.edu. Archived from the original on 5 June 2013. Retrieved 10 June 2013.
- ^ "Hungary's GDP (IMF, 2016 est.) is $265.037 billion x 39% = $103,36 billion". Portfolio online financial journal. Archived from the original on 3 March 2016. Retrieved 10 June 2013.
- ^ "Benchmarking global city competitiveness" (PDF). Economist Intelligence Unit. 2012. Archived from the original (PDF) on 9 July 2014. Retrieved 12 May 2014.
- ^ "ukmediacentre.pwc.com". PricewaterhouseCoopers. Archived from the original on 31 May 2013. Retrieved 12 May 2014.
- ^ "Monetary Policy". Hungarian National Bank. Retrieved 10 March 2016.
- ^ G.N. Georgano Cars: Early and Vintage, 1886–1930. (London: Grange-Universal, 1985)
- ^ "Warum die UdSSR nicht in die DDR einmarschierte". 3 October 2015. Retrieved 18 February 2020.
- ^ Spaller, Endre. "The Political and Economic Transition in Hungary". Medi(t)ations, (re)conciliations: Conflict Resolution and European Integration (PDF). Bratislava. pp. 85–90.
- ^ Megginson, William L.; Netter, Jeffry M. (2001). "From State to Market: A Survey of Empirical Studies on Privatization". Journal of Economic Literature. 39 (2): 321–389. doi:10.1257/jel.39.2.321. hdl:10419/154955.
- ^ Mihályi, P. (2001). "Foreign Direct Investment in Hungary – the Post-Communist Privatisation Story Re-Considered" (PDF). Acta Oeconomica. 51: 107–129. doi:10.1556/AOecon.51.2000-2001.1.5. S2CID 154331929.
- ^ "CIA – The World Factbook – Hungary". 28 March 2023.
- ^ Stalker, Peter (2010). A guide to countries of the world. Oxford paperback reference. Oxford university press. ISBN 978-0-19-958072-9.
- ^ Lynch, David J. (23 June 2006). "Hungary faces enormous economic hurdles". USA Today. Retrieved 5 December 2008.
- ^ a b c Iván Major (2003). Privatization in Hungary and its Aftermath. Edward Elgar Publishing. ISBN 978-1-84064-613-9. Retrieved 5 January 2010.
- ^ a b B. Vizvári; Zs. Bacsi (2 June 2003). "Structural Problems in Hungarian Agriculture After the Political Turnover". Journal of Central European Agriculture. Retrieved 5 January 2010.
- ^ Árpád Kovács. "Privatisation in Hungary (1990–2000)" (PDF). Archived from the original (PDF) on 7 June 2011. Retrieved 5 January 2010.
- ^ Anna Canning; Paul Hare. "Political Economy of Privatization in Hungary: A Progress Report" (PDF). Edinburgh: Department of Economics, Heriot-Watt University. Archived from the original (PDF) on 3 October 2011. Retrieved 5 January 2010.
- ^ a b c "Hungarian Finance Minister Lajos Bokros Explains His Package". The World Bank. Retrieved 12 November 2009.
- ^ "External trade by groups of countries in HUF (1991–2003)". KSH. Retrieved 12 November 2009. [dead link]
- ^ "Viták kereszttüzében: a Bokros-csomag (The Bokros Package in the Crossfire)" (in Hungarian). Világgazdaság Online. 15 December 2008. Archived from the original on 16 March 2010. Retrieved 12 November 2009.
- ^ "Background Note: Hungary". Bureau of Public Affairs: Electronic Information and Publications Office. June 2009. Retrieved 12 November 2009.
- ^ a b Mitchell A. Orenstein (2008). Privatizing pensions: the transnational campaign for social security reform. Princeton University Press. ISBN 978-0-691-13697-4. Retrieved 12 November 2009.
- ^ "Romló közhangulat, stabilizálódó Fidesz-előny (Deteriorating Public Morale, Fidesz's Advantage Stabilizing" (in Hungarian). Medián. 14 February 2007. Archived from the original on 16 February 2007. Retrieved 12 November 2009.
- ^ a b Inc, IBP (11 September 2015). Hungary Investment and Business Guide Volume 1 Strategic and Practical Information. Lulu.com. ISBN 978-1-5145-2857-0.
{{cite book}}:|last=has generic name (help) - ^ Kate Connolly; Ian Traynor (29 October 2008). "Hungary receives rescue package, with strings attached". The Guardian. Retrieved 18 January 2010.
- ^ "Economy and Society, January–March 2009" (PDF). Hungarian Central Statistical Office. Retrieved 18 January 2010.
- ^ Damien Mc Elroy (26 February 2009). "Global Financial Crisis: Hungary". The Daily Telegraph. London. Retrieved 18 January 2010.
- ^ a b Zoltan Simon (30 December 2011). "Hungary's Bailout Chance Wanes as Lawmakers Snub IMF, EU Over Central Bank". Bloomberg. Retrieved 30 December 2011.
- ^ Zoltan Simon (22 December 2011). "Hungary Top Court May Rule on Pension Fund Nationalization Case". Bloomberg. Retrieved 30 December 2011.
- ^ "Hungary GDP grows 1.4% yr/yr in Q4, up 1.7% in 2011". BBJ. Archived from the original on 29 March 2012. Retrieved 15 February 2012.
- ^ a b "Hungary borrowing costs rise on junk downgrade". BBC. 22 December 2011. Retrieved 27 December 2011.
- ^ a b "Hungary: playing chicken". The Guardian. 25 December 2011. Retrieved 27 December 2011.
- ^ "Third ratings agency gives Hungary a junk credit rating". BBC. 6 January 2012. Retrieved 9 January 2012.
- ^ Terminal Risks for Independent Fiscal Institutions: Lessons from IFIs in Hungary and Venezuela. Social Science Research Network (SSRN). Accessed 18 July 2017.
- ^ Barroso says unwillingness of Hungary to make changes pushes EC to act against Budapest Archived 18 January 2012 at the Wayback Machine, Politics.hu, 17 January 2012; accessed 21 January 2012
- ^ EU opens legal action against Hungary over new laws, BBC News, 17 January 2012; accessed 21 January 2012
- ^ Orbán says Hungary ready to cooperate to resolve EU infringement issues Archived 26 November 2013 at the Wayback Machine, Politics.hu, 18 January 2012; accessed 21 January 2012
- ^ Orbán tells European Parliament disputes a natural result of Hungarian government's “magnificent” efforts Archived 26 November 2013 at the Wayback Machine, Politics.hu, 18 January 2012; accessed 21 January 2012
- ^ Hungary PM Orbán fights back in European Parliament, BBC News, 18 January 2012; accessed 21 January 2012
- ^ Commission Staff Working Document: Country Report Hungary 2015 including an in-depth review on the prevention and correction of macroeconomic imbalances http://ec.europa.eu/europe2020/pdf/csr2015/cr2015_hungary_en.pdf
- ^ "Drivers of Inflation: Hungary". IMF. Retrieved 13 July 2023.
- ^ a b c d e "The Hungarian agriculture and food industry in figures" (PDF). Ministry of Agriculture and Rural Development. 2008. p. 5. Archived from the original (PDF) on 21 July 2011. Retrieved 31 December 2009.
- ^ "A hévízfeltárás, -termelés, -hasznosítás alakulása (Figures of the Exploration, Production, and Utilization of Thermal Springs)" (in Hungarian). Hungarian Ministry of Environment and Water. Archived from the original on 3 July 2007. Retrieved 18 January 2010.
- ^ "Magyarország természetföldrajzi adottságai (Geographical Properties of Hungary)" (in Hungarian). Retrieved 18 January 2010.
- ^ "Traffic of Budapest/Ferihegy Airport". Hungarian Central Statistical Office. Retrieved 18 January 2010. [dead link]
- ^ "Több villamosenergiát, de kevesebb gázt fogyasztott a lakosság (People Use more Electricity but Less Gas)" (in Hungarian). Hungarian News Agency Corp. 8 November 2009. Retrieved 18 January 2010. [permanent dead link]
- ^ Krisztina Than; Balazs Koranyi (7 January 2009). "Hungary receives no gas via Ukraine, industry suffers". Reuters. Retrieved 18 January 2010.
- ^ "Átadták a biztonsági földgáztárolót Algyőn (Security Gas Reserve Opened in Algyő)" (in Hungarian). Hungarian News Agency Corp. 1 October 2009. Archived from the original on 10 May 2010. Retrieved 18 January 2010.
- ^ "Settlements and dwellings with public water supply". Hungarian Central Statistical Office. Retrieved 18 January 2010. [dead link]
- ^ Ibolya Gazdag; János Rémai. "Hungarian National Wastewater Program". Hungarian Ministry of Transport, Communication, and Water Management. Archived from the original on 21 July 2011. Retrieved 18 January 2010.
- ^ "Hungary: Water & Wastewater Industry". 18 February 2009. Archived from the original on 20 January 2013. Retrieved 18 January 2010.
- ^ "Settlements and dwellings with public sewerage". Hungarian Central Statistical Office. Retrieved 18 January 2010. [dead link]
- ^ "ICT usage in households and by individuals". Hungarian Central Statistical Office. Retrieved 18 January 2010. [dead link]
- ^ "eHungary Program 2.0" (PDF). Hungarian Ministry of Economy and Transport. Archived from the original (PDF) on 28 August 2008. Retrieved 18 January 2010.
- ^ Marianna Posfai (8 January 2008). "eHungary". Retrieved 18 January 2010.
- ^ "Industry Breakdown of Companies in Hungary". HitHorizons.
- ^ "Value and distribution of gross value added by industries". Hungarian Central Statistical Office. 2009. Retrieved 31 December 2009. [dead link]
- ^ "Number of employed persons by industries". Hungarian Central Statistical Office. 2009. Retrieved 31 December 2009. [dead link]
- ^ Hungary production in 2018, by FAO
- ^ List of the entitled people for free insurance, National Healthcare Fund, 2013 [permanent dead link]
- ^ "Figyelő online -Társadalom – Dőzsölők és szűkölködők – Miből gazdálkodnak az egyházak?". Figyelő.hu. Archived from the original on 17 April 2015. Retrieved 3 March 2015.
- ^ "STADAT – 1.1. Népesség, népmozgalom (1949– )". Retrieved 3 March 2015.
- ^ "Newsroom". Retrieved 3 March 2015.
- ^ "Hungary – OECD Data". theOECD. Retrieved 23 September 2019.
- ^ "Health resources – Health spending – OECD Data". theOECD. Retrieved 23 September 2019.
- ^ "Elemzői reakciók az ipari termelési adatra (Analysts' Reaction on Industrial Production Data)" (in Hungarian). 7 April 2009. Archived from the original on 27 February 2012. Retrieved 18 January 2010.
- ^ "Food Industry". Archived from the original on 13 July 2011. Retrieved 18 January 2010.
- ^ "Mercedes Attacks BMW From Hungary With New Facility". The Washington Post. Archived from the original on 22 July 2013. Retrieved 29 March 2012.
- ^ "Automotive Industry". Archived from the original on 13 July 2011. Retrieved 18 January 2010.
- ^ a b c "The automotive industry in Hungary – Engine of growth". The Hungarian Investment and Trade Development Agency. Archived from the original on 13 July 2011. Retrieved 27 December 2009.
- ^ "Germany: Daimler Selects Plant Site". The New York Times. 19 June 2008. Retrieved 27 December 2009.
- ^ Koranyi, Balazs; Erica Billingham (27 October 2008). "Daimler sticks to Hungary investment despite crisis". Reuters. Retrieved 27 December 2009.
- ^ a b "15 éves az első magyar Opel (First Hungarian Opel Reaching Age of 15)". General Motors Corporation (in Hungarian). 8 March 2007. Archived from the original on 5 January 2010. Retrieved 2 January 2010.
- ^ "Statisztikai Tükör (Statistical Mirror)" (PDF). Hungarian Central Statistical Office. 26 March 2008. Retrieved 18 January 2010.
- ^ "Táblamelléklet (Tables)" (PDF). Hungarian Central Statistical Office. Retrieved 18 January 2010.
- ^ "UNWTO World Tourism Barometer" (PDF). World Tourism Organization. January 2013. Archived from the original (PDF) on 19 August 2008. Retrieved 3 January 2013.
- ^ "Hungarian Forint coins". Hungarian National Bank. 2009. Archived from the original on 3 January 2010. Retrieved 19 November 2009.
- ^ "Hungarian Forint banknotes". Hungarian National Bank. 2009. Archived from the original on 8 November 2009. Retrieved 19 November 2009.
- ^ "Hungarian Forint rounding". Hungarian National Bank. 2009. Archived from the original on 21 February 2009. Retrieved 19 November 2009.
- ^ "Withdrawn banknotes and coins". Hungarian National Bank. 2009. Archived from the original on 4 March 2010. Retrieved 19 November 2009.
- ^ "Inflation".
- ^ www
.ksh .hu /gyorstajekoztatok # /en /document /krm1912 - ^ "Hungary Government Debt to GDP". ec.europa.eu.
- ^ "Base rate history, MNB National Bank of Hungary".
- ^ "Convergence Report May 2008" (PDF). Retrieved 20 September 2009.
- ^ a b c d e f g h i Ministry of Education and Culture (2008). Education in Hungary (PDF). Department for EU Relations. pp. 19–20, 25–28, 36. ISBN 978-963-87399-5-7. Retrieved 25 November 2009.
- ^ Endre Sík (2005). "Foreign Language Speakers in Hungary" (in Hungarian). Tárki Ltd. Archived from the original on 18 July 2011. Retrieved 25 November 2009.
- ^ "2009 World University Rankings". QS Intelligence Unit. Archived from the original on 17 October 2009. Retrieved 25 November 2009.
- ^ The Programme for International Student Assessment (PISA). OECD. 2006. pp. 33–34. ISBN 978-92-64-04000-7. Retrieved 25 November 2009.
- ^ Júlia Varga, "Returns to education in Hungary." Acta Oeconomica 47.1/2 (1995): 203–215 online.
- ^ a b "Distribution of income or consumption" (PDF). World Bank. 2007. Retrieved 21 December 2009.
- ^ "A Dollar A Day – Poverty Overview – Gini Coefficient Map". Archived from the original (swf) on 19 October 2012. Retrieved 21 December 2009.
- ^ "Richest Hungarian continues to get richer". 20 June 2008. Archived from the original on 6 March 2009. Retrieved 21 December 2009.
- ^ "National Programme for the European Year for Combating Poverty and Social Exclusion". Ministry of Social Affairs and Labour. p. 2. Archived from the original on 21 July 2011. Retrieved 21 December 2009.
- ^ a b c d "Human Development Report 2009 – Hungary". United Nations Development Programme. 2009. Archived from the original on 12 October 2009. Retrieved 21 December 2009.
- ^ a b c d e "Key Development Data & Statistics". World Bank. Retrieved 21 December 2009.
- ^ "Healthy life years at birth by gender". Eurostat. 2007. Retrieved 21 December 2009.
- ^ Gábor Kertesi; Kábor Kézdi. "Roma Employment in Hungary After the Post-Communist Transition" (PDF). Budapest. Archived from the original (PDF) on 12 June 2011. Retrieved 27 December 2009.
- ^ "Inequality and discrimination in employment". 21 January 2008. Retrieved 27 December 2009.
- ^ Gábor Kertesi; Gábor Kézdi (2005). "Roma children in the transformational recession – Widening ethnic schooling gap and Roma poverty in post-communist Hungary". Budapest. Retrieved 27 December 2009.
- ^ a b Gábor Kertesi (2005). "Roma foglalkoztatás az ezredfordulón (Roma Employment on the Turn of Millennium)" (PDF) (in Hungarian). Budapest. Retrieved 27 December 2009.
- ^ a b Béla Janky (2005). "The Income Situation of Gypsy Families" (PDF). Budapest: TÁRKI. Archived from the original (PDF) on 18 July 2011. Retrieved 27 December 2009.
- ^ "Data in Focus Report: The Roma" (PDF). European Union Fundamental Rights Agency. 2009. Archived from the original (PDF) on 1 April 2010. Retrieved 27 December 2009.
- ^ "A Hernád-völgyi romák munkaerőpiaci felzárkóztatása – A program helyszínének bemutatása (Convergence of Roma Employment in the Hernád Valley–Introducing the Setting of the Program)" (in Hungarian). Budapest: Autonómia Alapítvány. Archived from the original on 5 April 2009. Retrieved 27 December 2009.
- ^ a b c "Hungary: Corruption continues". Organized Crime and Corruption Reporting Project. 16 December 2008. Retrieved 3 January 2010.
- ^ Riaño, Juanita; Hodess, Robin; Evans, Alastair (16 December 2008). "Global Corruption Barometer 2009". Transparency International. p. 8. Archived from the original on 7 June 2009. Retrieved 3 January 2010.
- ^ "Doing Business 2010 – Hungary" (PDF). Washington, D.C.: The World Bank. 2009. Archived from the original (PDF) on 2 October 2009. Retrieved 3 January 2010.
- ^ "Paying Taxes 2010 – The Global Picture" (PDF). 2009. Retrieved 3 January 2010.
- ^ "Background Note: Hungary". U.S. Department of State. June 2009. Retrieved 3 January 2010.
- ^ Ina Mimireva (29 October 2009). "Hungary Investment Climate 2009". EUbusiness. Retrieved 3 January 2010.
- ^ "Hungarian National Bank homepage".
- ^ "Törvények és OGY határozatok (Laws and Decrees)" (in Hungarian). Retrieved 18 January 2010.
- ^ "Monetary policy". Retrieved 18 January 2010.
- ^ Gergely Kiss; Judit Krekó (2004). "The Optimal Rate of Inflation in Hungary". Hungarian National Bank. Retrieved 1 November 2009. [permanent dead link]
- ^ "Közlemény a középtávú inflációs cél kitűzéséről (Announcement on Mid-term Inflation Plans)" (in Hungarian). Hungarian National Bank. 25 August 2005. Archived from the original on 16 November 2008. Retrieved 18 January 2010.
- ^ a b "A gazdasági növekedés dinamizálásának lehetősége az államháztartási kiadások csökkentése mellett (Possibilities of Boosting Economic Growth while Decreasing Public Deficit)" (PDF) (in Hungarian). Attila Bartha et al. 10 March 2009. Archived from the original (PDF) on 21 July 2011. Retrieved 18 January 2010.
- ^ "Interjú Gere Ádámmal, a Hayek Társaság elnökével (Interview with Adam Gere, Chairman of Hayek Institute)" (in Hungarian). hetek.hu. 2003. Retrieved 31 October 2009.
- ^ "Főbb makrogazdasági jelzőszámok (Main Macroeconomic Indicators)" (in Hungarian). Ministry of Finance. 2009. Archived from the original (xls) on 15 February 2010. Retrieved 31 October 2009.
- ^ "Quarterly Report on Inflation". Hungarian National Bank. August 2009. Archived from the original on 19 September 2015. Retrieved 31 October 2009.
- ^ "Introducing the Euro: convergence criteria". Europa.eu. 7 December 2006. Retrieved 31 October 2009.
- ^ "IMF, EU, and World Bank Line Up $25 Billion for Hungary". IMF Survey Magazine. 28 October 2008. Retrieved 31 October 2009.
- ^ a b "Összefoglaló makroökonómiai adatok (Summary of Macroeconomic Indicators)" (in Hungarian). Hungarian National Bank. 2009. Archived from the original (xls) on 2 January 2010. Retrieved 31 October 2009.
- ^ Dánel Baksa; et al. (18 August 2009). "Elemzés a makrogazdasági kilátásokról és a költségvetési kockázatokról (Essay on the Macroeconomic Outlook and Fiscal Risks)" (PDF) (in Hungarian). Budget Council. Archived from the original (PDF) on 4 November 2009. Retrieved 18 January 2010.
- ^ Mihály Hőgye. "Reflection on the Hungarian Tax System and Reform Steps" (PDF). Archived from the original (PDF) on 5 October 2011. Retrieved 18 January 2010.
- ^ "Adózás (Taxation)" (in Hungarian). Archived from the original on 22 September 2010. Retrieved 18 January 2010.
- ^ "Short summary on the taxation of individuals". Tax and Financial Control Administration. 1 July 2009. Archived from the original on 6 January 2010. Retrieved 18 January 2010.
- ^ "Az adózók 24 százléka vall minimálbért (24% of Taxpayers Claim They're on Minimum Wage)" (in Hungarian). Hungarian News Agency Corp. 2 September 2009. Retrieved 18 January 2010.
- ^ "Deloitte Tax News » Hungary: Corporate Income Tax and VAT changes 2012". Deloittetax.at. 1 January 2012. Retrieved 2 April 2012.
- ^ "Report for Selected Countries and Subjects". imf.org. Retrieved 30 September 2023.
- ^ "IT and telecommunications in Central and Eastern Europe". Ceeitandtelecom.com. Archived from the original on 11 October 2013. Retrieved 2 April 2012.
- ^ "Referendum on the accesion [sic] to the European Union 2003". National Election Office. 12 April 2003. Archived from the original on 13 August 2009. Retrieved 18 January 2010.
- ^ "EU free movement of labour map". London: BBC. 17 April 2009. Retrieved 18 January 2010.
External links edit
- Economy at the Hungarian Central Statistical Office
- Ministry for National Economy – Leading economy news Archived 6 May 2017 at the Wayback Machine
- Central Bank of Hungary – Leading finance news
- Hungary profile at the CIA World Factbook
- Hungarian economy profile at The World Bank
- Hungarian economy profile at the Organisation for Economic Co-operation and Development
- Hungarian economy profile at the International Monetary Fund