


Summary
The economy of Indonesia is a mixed economy with dirigiste characteristics,[30][31] and it is one of the emerging market economies in the world and the largest in Southeast Asia. As an upper-middle income country and member of the G20, Indonesia is classified as a newly industrialized country.[32] Estimated at over 21 quadrillion rupiah in 2023, it is the 16th largest economy in the world by nominal GDP and the 7th largest in terms of GDP (PPP). Indonesia's internet economy reached US$77 billion in 2022, and is expected to cross the US$130 billion mark by 2025.[33] Indonesia depends on the domestic market and government budget spending and its ownership of state-owned enterprises (the central government owns 141 enterprises). The administration of prices of a range of basic goods (including rice and electricity) also plays a significant role in Indonesia's market economy. However, since the 1990s, the majority of the economy has been controlled by individual Indonesians and foreign companies.[34][35][36]
 Jakarta, the financial centre of Indonesia | |
| Currency | Rupiah (IDR, Rp) |
|---|---|
| Calendar year | |
Trade organizations | APEC, WTO, G-20, IOR-ARC, RCEP, AFTA, ASEAN, EAS, ADB, others |
Country group | |
| Statistics | |
| Population | |
| GDP | |
| GDP rank | |
GDP growth | |
GDP per capita | |
GDP per capita rank | |
GDP by sector |
|
Population below poverty line |
|
| |
Labour force | |
Labour force by occupation |
|
| Unemployment | |
Main industries | palm oil, coal, petroleum, petrochemicals, liquified natural gas, vehicle, electronics, transportation, machinery, steel, telecommunication, electric power, food processing, wood industry, textile, footwear, consumer goods, integrated circuits, medical equipment, optical devices, paper, handicrafts, chemicals, rubber, pharmaceuticals, financial services, seafood, smelting, and tourism |
| External | |
| Exports | $259 billion (2023)[19] |
Export goods | Palm oil, Steel, Metal, Machinery and Industrial equipment, Chemicals products, Liquefied natural gas, Textiles products, Footwear products, Automobiles, Transportation products, Wooden products, Plastics |
Main export partners |
|
| Imports | $222 billion (2023)[19] |
Import goods | Machinery and Industrial equipment, Steel, Foodstuffs, Petroleum products, Electronics, Raw material, Chemicals products, Transportation products |
Main import partners |
|
FDI stock | |
Gross external debt | |
| Public finances | |
| −0.89% (of GDP) (2024 est.)[22] | |
| Revenues | $176.6 billion (2022 est.)[23] |
| Expenses | $207.8 billion (2022 est.)[8] |
| |
| $146.4 Billion (Dec 2023)[29] | |
In the aftermath of the 1997 Asian financial crisis, the government took custody of a significant portion of private sector assets through the acquisition of nonperforming bank loans and corporate assets through the debt restructuring process, and the companies in custody were sold for privatization several years later. Since 1999, the economy has recovered, and growth accelerated to over 4–6% in the early 2000s.[37] In 2012, Indonesia was the second fastest-growing G-20 economy, behind China, and the annual growth rate fluctuated around 5% in the following years.[38][39] Indonesia faced a recession in 2020 when the economic growth collapsed to −2.07% due to the COVID-19 pandemic, its worst economic performance since the 1997 crisis.[40]
In 2022, gross domestic product expanded by 5.31%, due to the removal of COVID-19 restrictions as well as record-high exports driven by stronger commodity prices.[41]
Indonesia is predicted to be the 4th largest economy in the world by 2045. Joko Widodo has stated that his cabinet's calculations showed that by 2045, Indonesia will have a population of 309 million people. By Widodo's estimate, there would be economic growth of 5−6% and GDP of US$9.1 trillion. Indonesia's income per capita is expected to reach US$29,000.[42]
History edit
Sukarno era edit
In the years immediately following the proclamation of Indonesian independence, both the Japanese occupation and the conflict between Dutch and Republican forces had crippled the country's production, with exports of commodities such as rubber and oil being reduced to 12 and 5% of their pre-WW2 levels, respectively.[43] The first Republican government-controlled bank, the Indonesian State Bank (Bank Negara Indonesia, BNI) was founded on 5 July 1946. It initially acted as the manufacturer and distributor of ORI (Oeang Republik Indonesia/Money of the Republic of Indonesia), a currency issued by the Republican Government which was the predecessor of Rupiah.[44] Despite this, currency issued during the Japanese occupation and by Dutch authorities was still in circulation, and the simplicity of the ORI made its counterfeiting relatively easy, worsening matters.[45] Between 1949 and 1960, Indonesia experienced several economic disruptions. The country's independence recognized by the Netherlands, the dissolution of the United States of Indonesia in 1950, the subsequent liberal democracy period, the nationalization of De Javasche Bank into the modern Bank Indonesia,[46] and the takeover of Dutch corporate assets following the West New Guinea dispute,[47] which all resulted in the devaluation of Dutch banknotes into half their value.[48]
During the guided democracy era in the 1960s, the economy deteriorated drastically as a result of political instability. The government was inexperienced in implementing macroeconomic policies, which resulted in severe poverty and hunger. By the time of Sukarno's downfall in the mid-1960s, the economy was in chaos with 1,000% annual inflation, shrinking export revenues, crumbling infrastructure, factories operating at minimal capacity, and negligible investment.[49] Nevertheless, Indonesia's post-1960 economic improvement was considered remarkable when taking into consideration how few indigenous Indonesians in the 1950s had received a formal education under Dutch colonial policies.[50]
New Order edit
Following President Sukarno's downfall, the New Order administration brought a degree of discipline to economic policy that quickly brought inflation down, stabilized the currency, rescheduled foreign debt, and attracted foreign aid and investment. (See Inter-Governmental Group on Indonesia and Berkeley Mafia). Indonesia was until recently Southeast Asia's only member of OPEC, and the 1970s oil price rise provided an export revenue windfall that contributed to sustained high economic growth rates, averaging over 7% from 1968 to 1981.[51]
With high levels of regulation and dependence on declining oil prices, growth slowed to an average of 4.5% per annum between 1981 and 1988. A range of economic reforms was introduced in the late 1980s, including a managed devaluation of the rupiah to improve export competitiveness, and deregulation of the financial sector.[51] Foreign investment flowed into Indonesia, particularly into the rapidly developing export-oriented manufacturing sector, and from 1989 to 1997, the Indonesian economy grew by an average of over 7%.[51][52] GDP per capita grew 545% from 1970 to 1980 as a result of the sudden increase in oil export revenues from 1973 to 1979.[53] High levels of economic growth masked several structural weaknesses in the economy. It came at a high cost in terms of weak and corrupt governmental institutions, severe public indebtedness through mismanagement of the financial sector, rapid depletion of natural resources, and culture of favors and corruption in the business elite.[54]
Corruption particularly gained momentum in the 1990s, reaching to the highest levels of the political hierarchy as Suharto became the most corrupt leader according to Transparency International.[55][56] As a result, the legal system was weak, and there was no effective way to enforce contracts, collect debts, or sue for bankruptcy. Banking practices were very unsophisticated, with collateral-based lending the norm and widespread violation of prudential regulations, including limits on connected lending. Non-tariff barriers, rent-seeking by state-owned enterprises, domestic subsidies, barriers to domestic trade and export restrictions all created economic distortions.
The 1997 Asian financial crisis that began to affect Indonesia became an economic and political crisis. The initial response was to float the rupiah, raise key domestic interest rates, and tighten fiscal policy. In October 1997, Indonesia and the International Monetary Fund (IMF) reached an agreement on an economic reform program aimed at macroeconomic stabilization and the elimination of some of the country's most damaging economic policies, such as the National Car Program and the clove monopoly, both involving family members of Suharto. The rupiah remained weak, however, and Suharto was forced to resign in May 1998 after massive riots erupted. In August 1998, Indonesia and the IMF agreed on an Extended Fund Facility (EFF) under President B. J. Habibie that included significant structural reform targets. President Abdurrahman Wahid took office in October 1999, and Indonesia and the IMF signed another EFF in January 2000. The new program also has a range of economic, structural reform, and governance targets.
The effects of the crisis were severe. By November 1997, rapid currency depreciation had seen public debt reach US$60 billion, imposing severe strains on the government's budget.[57] In 1998, real GDP contracted by 13.1%, and the economy reached its low point in mid-1999 with 0.8% real GDP growth. Inflation reached 72% in 1998 but slowed to 2% in 1999. The rupiah, which had been in the RP 2,600/USD1 range at the start of August 1997 fell to 11,000/USD1 by January 1998, with spot rates around 15,000 for brief periods during the first half of 1998.[58] It returned to the 8,000/USD1 range at the end of 1998 and has generally traded in the Rp 8,000–10,000/USD1 range ever since, with fluctuations that are relatively predictable and gradual. However, the rupiah began devaluing past 11,000 in 2013, and as of November 2016 is around 13,000 Rp/USD1.[59]
Reform era edit
Since an inflation target was introduced in 2000, the GDP deflator and the CPI have grown at an average annual pace of 10¾% and 9%, respectively, similar to the pace recorded in the two decades prior to the 1997 crisis, but well below the pace in the 1960s and 1970s.[60] Inflation has also generally trended lower through the 2000s, with some of the fluctuations in inflation reflecting government policy initiatives such as the changes in fiscal subsidies in 2005 and 2008, which caused large temporary spikes in CPI growth.[61]

| Share of world GDP (PPP)[22] | |
|---|---|
| Year | Share |
| 1980 | 1.42% |
| 1990 | 1.92% |
| 2000 | 1.94% |
| 2010 | 2.28% |
| 2020 | 2.47% |
| 2024 | 2.54% |
In late 2004, Indonesia faced a 'mini-crisis' due to international oil prices rises and imports. The currency exchange rate reached Rp 12,000/USD1 before stabilizing. Under President Susilo Bambang Yudhoyono (SBY), the government was forced to cut its massive fuel subsidies, which were planned to cost $14 billion in October 2005.[62] This led to a more than doubling in the price of consumer fuels, resulting in double-digit inflation. The situation had stabilized but the economy continued to struggle with inflation at 17% in late 2005. Economic outlook became more positive as the 2000s progressed. Growth accelerated to 5.1% in 2004 and reached 5.6% in 2005. Real per capita income has reached fiscal levels in 1996–1997. Growth was driven primarily by domestic consumption, which accounts for roughly three-fourths of Indonesia's gross domestic product (GDP). The Jakarta Stock Exchange was the best performing market in Asia in 2004, up by 42%. Problems that continue to put a drag on growth include low foreign investment levels, bureaucratic red tape, and widespread corruption which costs RP. 51.4 trillion (US$5.6 billion) or approximately 1.4% of GDP annually.[citation needed] However, there is a robust economic optimism due to the conclusion of the peaceful 2004 elections.
As of February 2007, the unemployment rate was 9.75%.[63] Despite a slowing global economy, Indonesia's economic growth accelerated to a ten-year high of 6.3% in 2007. This growth rate was sufficient to reduce poverty from 17.8% to 16.6% based on the government's poverty line and reversed the recent trend towards jobless growth, with unemployment falling to 8.46% in February 2008.[64][65] Unlike many of its more export-dependent neighbors, Indonesia has managed to skirt the recession helped by strong domestic demand (which makes up about two-thirds of the economy) and a government fiscal stimulus package of about 1.4% of GDP. After India and China, Indonesia was the third-fastest growing economy in the G20. With the $512 billion economy expanded 4.4% in the first quarter from a year earlier and last month, the IMF revised its 2009 Indonesia forecast to 3–4% from 2.5%. Indonesia enjoyed stronger fundamentals with the authorities implemented wide-ranging economic and financial reforms, including a rapid reduction in public and external debt, strengthening of corporate and banking sector balance sheets and reducing bank vulnerabilities through higher capitalization and better supervision.[66]
In 2012, Indonesia's real GDP growth reached 6%, then it steadily decreased below 5% until 2015. After Joko Widodo succeeded SBY, the government took measures to ease regulations for foreign direct investments to stimulate the economy.[67] Indonesia managed to increase their GDP growth slightly above 5% in 2016–2017.[68] However, the government is currently still facing problems such as currency weakening, decreasing exports and stagnating consumer spending.[69][70] The current unemployment rate for 2019 is at 5.3%.[71]
Reform happened in Indonesia around the 1980s, when the Indonesian government states it will be attempting to economically integrate with global economies. They stated in 2017 that "Globalisation has made it difficult for the Indonesian economy to balance all other factors of the economy".[citation needed]
Data edit
The following table shows the main economic indicators in 1980–2022 (with IMF staff estimates in 2023–2028). Inflation under 5% is in green.[72]
| Year | GDP
(in Bil. US$PPP) |
GDP per capita
(in US$ PPP) |
GDP
(in Bil. US$nominal) |
GDP per capita
(in US$ nominal) |
GDP growth
(real) |
Inflation rate
(in Percent) |
Unemployment
(in Percent) |
Government debt
(in % of GDP) |
|---|---|---|---|---|---|---|---|---|
| 1980 | 189.7 | 1,286.3 | 99.3 | 673.2 | n/a | n/a | ||
| 1981 | n/a | n/a | ||||||
| 1982 | n/a | n/a | ||||||
| 1983 | n/a | n/a | ||||||
| 1984 | 1.6% | n/a | ||||||
| 1985 | n/a | |||||||
| 1986 | n/a | |||||||
| 1987 | n/a | |||||||
| 1988 | n/a | |||||||
| 1989 | n/a | |||||||
| 1990 | n/a | |||||||
| 1991 | n/a | |||||||
| 1992 | n/a | |||||||
| 1993 | n/a | |||||||
| 1994 | n/a | |||||||
| 1995 | n/a | |||||||
| 1996 | n/a | |||||||
| 1997 | n/a | |||||||
| 1998 | n/a | |||||||
| 1999 | n/a | |||||||
| 2000 | 87.4% | |||||||
| 2001 | ||||||||
| 2002 | ||||||||
| 2003 | ||||||||
| 2004 | ||||||||
| 2005 | ||||||||
| 2006 | ||||||||
| 2007 | ||||||||
| 2008 | ||||||||
| 2009 | ||||||||
| 2010 | ||||||||
| 2011 | ||||||||
| 2012 | ||||||||
| 2013 | ||||||||
| 2014 | ||||||||
| 2015 | ||||||||
| 2016 | ||||||||
| 2017 | ||||||||
| 2018 | ||||||||
| 2019 | ||||||||
| 2020 | ||||||||
| 2021 | ||||||||
| 2022 | ||||||||
| 2023 | ||||||||
| 2024 | ||||||||
| 2025 | ||||||||
| 2026 | ||||||||
| 2027 | ||||||||
| 2028 |
- Grey colors are estimations
Structure edit
Indonesia’s economy in 2023, as measured by Gross Domestic Product (GDP) at current market prices, reached IDR 20,892.4 trillion. The highest growth on the production side was Transportation and Storage at 13.96%. During 2023, the Indonesian economy continued to grow spatially. The group of provinces according to the islands, the provinces with the highest growth were Maluku and Papua, Sulawesi, and Kalimantan with growth (c-to-c) of 6.94%, 6.37% and 5.43%. Meanwhile, the group of provinces on Jawa Island which contributed 57.05% to the national economy recorded a growth of 4.96% (c-to-c).[73]
Composition edit
| Composition[73] | Sector | 2022 output (in trillion rupiahs) | 2023 output (in trillion rupiahs) | Constant Growth | Contribution in 2023 output | |
|---|---|---|---|---|---|---|
| Agriculture | Agriculture | 2,428.9 | 2,617.7 | 1.30% | 12.53% | 12.53% |
| Industrial | Mining and Quarrying | 2,393.4 | 2,198.0 | 6.12% | 10.52% | 40.18% |
| Manufacturing | 3,591.8 | 3,900.1 | 4.64% | 18.67% | ||
| Electricity and Gas | 204.7 | 218.2 | 4.91% | 1.04% | ||
| Water | 12.5 | 13.3 | 4.90% | 0.06% | ||
| Construction | 1,913.0 | 2,072.4 | 4.85% | 9.92% | ||
| Services | Wholesale and Retail Trade | 2,516.7 | 2,702.4 | 4.85% | 12.94% | 42.91% |
| Transportation and Storage | 983.5 | 1,231.2 | 13.96% | 5.89% | ||
| Accommodation and Food Services | 472.0 | 526.3 | 10.01% | 2.52% | ||
| Information and Communication | 812.7 | 883.6 | 7.59% | 4.23% | ||
| Financial and Insurance Activities | 809.4 | 869.2 | 4.77% | 4.16% | ||
| Real Estate | 488.3 | 505.5 | 1.43% | 2.42% | ||
| Business Activities | 341.4 | 383.1 | 8.24% | 1.83% | ||
| Public Administration and Defense | 604.9 | 616.4 | 1.50% | 2.95% | ||
| Education | 566.5 | 583.6 | 1.78% | 2.79% | ||
| Human Health and Social Work | 236.2 | 252.0 | 4.66% | 1.21% | ||
| Other Services | 354.2 | 405.2 | 10.52% | 1.94% | ||
| Tax Less Subsidies | Tax Less Subsidies | 858.0 | 914.2 | 4.94% | 4.38% | 4.38% |
| Indonesia | Total | 19,588.1 | 20,892.4 | 5.05% | 100.00% | 100.00% |
Sectors edit
Agriculture edit
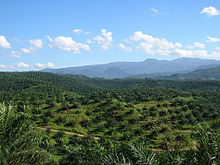
Agriculture is a key sector which contributed to 14.43% of GDP.[74] Currently, there are around 30% of the land area used for agriculture and employed about 49 million people (41% of the total workforce).[75] Primary agriculture commodities include rice, cassava (tapioca), peanuts, natural rubber, cocoa, coffee, palm oil, copra; poultry, beef, pork, and eggs. Palm oil production is vital to the economy as Indonesia is the world's biggest producer and consumer of the commodity, providing about half of the world's supply.[76] Plantations in the country stretch across 6 million hectares as of 2007,[77] with a replanting plan set for an additional 4.7 million to boost productivity in 2017.[78] There are a number of negative social and environmental impacts of palm oil production in Southeast Asia.
Seafood edit
In 2015, the total production of seafood reached about 22.31 million metric tons, valued at around 18.10 billion US dollars. For capture of wild fish (both inland and marine), the production trend was steady in 2011–2015, while there was a steep increase in the production from aquaculture during the same period.[79]
Oil and mining edit

Indonesia was the only South East Asian member of the Organization of Petroleum Exporting Countries (OPEC) until its suspension in 2009. The country currently remains a net oil importer despite its large petroleum production industry.[80] In 1999, crude and condensate output averaged 1.5 million barrels (240,000 m3) per day, and in 1998, the oil and gas sector including refining, contributed approximately 9% to GDP. As of 2005, crude oil and condensate output were 1.07 million barrels (170,000 m3) per day. It indicates a substantial decline from the 1990s, due primarily to ageing oil fields and a lack of investment in oil production equipment. This decline in production has been accompanied by a substantial increase in domestic consumption, about 5.4% per year, leading to an estimated US$1.2 billion cost for importing oil in 2005. The state owns all petroleum and mineral rights. Foreign firms participate through production-sharing and work contracts. Oil and gas contractors are required to finance all exploration, production, and development costs in their contract areas and are entitled to recover operating, exploration, and development costs out of the oil and gas produced. Indonesia had previously subsidized fuel prices to keep prices low, costing US$7 billion in 2004.[81] SBY has mandated a significant reduction of government subsidy of fuel prices in several stages.[82] The government has stated that cuts in subsidies are aimed at reducing the budget deficit to 1% of GDP in 2005, down from around 1.6% last year. At the same time, the government has offered one-time subsidies for qualified citizens, to alleviate hardships.
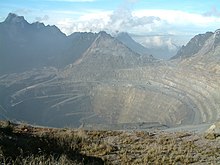
Indonesia is the world's largest tin market. Although mineral production traditionally centered on bauxite, silver, and tin, it is expanding its copper, nickel, gold, and coal output for export markets. In mid-1993, the Department of Mines and Energy reopened the coal sector to foreign investment, resulting in a joint venture between Indonesian coal producer and BP and Rio Tinto Group. Total coal production reached 74 million metric tons in 1999, including exports of 55 million tons, and in 2011, production was 353 million. As of 2014, Indonesia is the third-largest producer with a total output of 458 Mt and export of 382 Mt.[83] At this rate, the reserves will be used up in 61 years until 2075.[84] Not all of the productions can be exported due to Domestic Market Obligation (DMO) regulation, which should fulfill the domestic market. In 2012, the DMO was 24.72%. Starting from 2014, no low-grade coal exports are allowed, so the upgraded brown coal process that cranks up the calorie value of coal from 4,500 to 6,100 kcal/kg will be built in South Kalimantan and South Sumatra.[85] Indonesia is also the world's largest producer of nickel,[86] and the second-largest producer of cobalt in 2022.[87]
Two US firms operate three copper/gold mines in Indonesia, with a Canadian and British firm holding significant other investments in nickel and gold, respectively. India's fortune groups like Vedanta Resources and Tata Group also have substantial mining operations in Indonesia. In 1998, the value of Indonesian gold and copper production was $1 billion and $843 million respectively. Receipts from gold, copper, and coal accounted for 84% of the $3 billion earned in 1998 by the mineral mining sector. With the addition of Alumina project that produces 5% of the world's alumina production, Indonesia would be the world's second-largest Alumina producer. The project will not make the ores to become aluminum, as there are 100 types of Alumina derivatives that can be developed further by other companies in Indonesia.[88]
Joko Widodo's administration continued the resource nationalism policy of SBY, nationalizing some assets controlled by multinational companies such as Freeport McMoRan, TotalEnergies and Chevron. In 2018, in a move aimed to cut imports, oil companies operating in Indonesia were ordered to sell their crude oil to state-owned Pertamina.[89]
Manufacturing edit
Indonesia's manufacturing sector has historically played a key role in the country's economic development and now contributes to 20 percent of GDP. The government has ambitious plans to propel the country into the top ten biggest economies in the world by 2030, with manufacturing at the heart of this goal. The main areas of production include textiles and garments, food and beverages (F&B), electronics, automotive, and chemicals, with the majority of manufacturers in this sector consisting of micro, small, or medium-sized enterprises. The sector has posted a consistent four percent growth year-on-year since 2016 and registered 147 trillion rupiah (US$8.9 billion) in investments from January to September 2019.[90]
Indonesia recently became the 10th-largest manufacturing nation in the world. Its large manufacturing sector accounts for almost a quarter of the nation's total GDP and employs over a fifth of Indonesia's working age population (around 25 million workers). Put into perspective, Indonesia's manufacturing sector is now larger than the manufacturing sectors of the United Kingdom, Russia and Mexico. Industry sector (including manufacturing) which accounts for 21% of local workers (having become more prominent in recent years). Indonesia's labour pool is estimated at 120 million people, and is growing annually by approximately 2.4 million. As the economy has progressed beyond its predominantly agricultural base to a mixed composition, more workers – particularly women – are now employed in manufacturing and service-related professional industries.[91]
With its rapidly growing middle class and competitive workforce, more foreign investors than ever before are taking advantage of Indonesia's strong manufacturing sector. However, the sector has significant challenges, including intense international competition, particularly from China, increasing labour costs, high transportation and logistics costs, difficulties getting credit, and varying levels of transparency and clarity in regulations.
Renewable energy edit
Indonesia has significant potential for developing renewable energy, however, the country continues to rely heavily on the use of fossil fuels in domestic electricity production.[92] Continued investment in and reliance on fossil fuels, such as coal, may result in fossil fuels becoming stranded assets, leading to significant investments lost that the country could have received from renewable energy investors.[93]
Automotive industry edit
In 2010, Indonesia sold 7.6 million motorcycles, which were mainly produced in the country with almost 100% local components. Honda led the market with a 50.95% market share, followed by Yamaha with 41.37%.[94] In 2011, the retail car sales total was 888,335 units, a 19.26% increase from last year. Toyota dominated the domestic car market (35.34%), followed by Daihatsu and Mitsubishi with 15.44% and 14.56%, respectively.[95] Since 2011, some local carmakers have introduced some Indonesian national cars which can be categorized as Low-Cost Green Car (LCGC). In 2012, sales increased significantly by 24%, making it the first time that there were more than one million units in automobile sales.[96]

In August 2014, Indonesia exported 126,935 Completely Build Up (CBU) vehicle units and 71,000 Completely Knock Down (CKD) vehicle units, while total production reached 878,000 vehicle units, constituting 22.5% of total output. Automotive export is more than double of its import. By 2020, it is predicted that the automotive exports will be the third after CPO and shoe export.[97] In August 2015, Indonesia exported 123,790 motorcycles. In the same year, Yamaha Motor Company, which exported 82,641, announced to make Indonesia as a base of exporting of its products.[98]
In 2017, the country produced almost 1.2 million motor vehicles, ranking it as the 18th largest producer in the world.[99] Nowadays, Indonesian automotive companies can produce cars with a high ratio of local content (80%–90%).[100]
In 2018, the country produced 1.34 million cars and exported 346,000 cars, mainly to the Philippines and Vietnam.[101]
Finance, real estate and business edit

There are 50 million small businesses in Indonesia, with online usage growth of 48% in 2010. Google announced that it would open a local office in Indonesia before 2012.[102] According to Deloitte in 2011, Internet-related activities have generated 1.6% of the GDP. It is bigger than electronic and electrical equipment exports and liquefied natural gas at 1.51% and 1.45% respectively.[103]
Up to the end of June 2011, the fixed state assets were Rp 1,265 trillion ($128 billion). The value of state stocks was Rp 50 trillion ($5 billion) while other state assets were Rp 24 trillion ($2.4 billion).[104]
In 2015, financial services covered Rp 7,2 trillion. Fifty domestic and foreign conglomerations held around 70.5%. Fourteen of it were vertical conglomerations, 28 were horizontal, and eight are mixed. Thirty-five entities are mainly in the bank industries, 13 were in non-bank industries and one each in special financial industries and capital market industries.[105]
Others edit
The Indonesian Textile Association has reported that in 2013, the textile sector is likely to attract investment of around $175 million. In 2012, the investment in this sector was $247 million, of which only $51 million was for new textile machinery.[106] Exports from the textile sector in 2012 were $13.7 billion.
In 2011, Indonesia released 55,010 working visas for foreigners, an increase of 10% compared to 2010, while the number of foreign residents in Indonesia, excluding tourists and foreign emissaries was 111,752, rose by 6% compared to last year. Those who received visas for six months to one year were mostly Chinese, Japanese, South Koreans, Indians, Americans and Australians. A few of them were entrepreneurs who made new businesses. Malaysia is the most common destination of Indonesian migrant workers (including illegal workers). In 2010, according to a World Bank report, Indonesia was among the world's top ten remittance-receiving countries with a value totaling $7 billion.[107] In May 2011, six million Indonesian citizens were working overseas, 2.2 million of whom reside in Malaysia and another 1.5 million in Saudi Arabia.[108]
Regional economies edit
GDP by provinces edit
There are 34 provinces in Indonesia. Below are the top 15 provinces in Indonesia ranked by GDP in 2019:
| Rank | Province | Region | GDP (in billion Rp) |
GDP nominal | GDP PPP | |
|---|---|---|---|---|---|---|
| (in billion $) | Comparable country | (in billion $) | ||||
| - | South East Asia | 16,073,257 | 1,136.72 | 3,329.17 | ||
| 1 | Java | 2,840,828 | 200.91 | 588.42 | ||
| 2 | Java | 2,352,425 | 166.37 | 487.27 | ||
| 3 | Java | 2,125,158 | 150.30 | 440.19 | ||
| 4 | Java | 1,362,457 | 96.35 | 282.18 | ||
| 5 | Sumatra | 801,733 | 56.70 | 166.06 | ||
| 6 | Sumatra | 765,198 | 54.12 | 158.51 | ||
| 7 | Java | 664,963 | 47.03 | 137.74 | ||
| 8 | Kalimantan | 653,677 | 46.23 | 135.40 | ||
| 9 | Sulawesi | 504,747 | 35.70 | 104.56 | ||
| 10 | Sumatra | 455,233 | 32.19 | 94.28 | ||
| 11 | Sumatra | 360,664 | 25.51 | 74,71 | ||
| 12 | Sumatra | 268,080 | 18.96 | 55.53 | ||
| 13 | Lesser Sunda Islands | 252,598 | 17.86 | 52.31 | ||
| 14 | Sumatra | 246,423 | 17.42 | 51.01 | ||
| 15 | Sumatra | 217,712 | 15.40 | 45.10 | ||
Foreign economic relations edit
ASEAN edit
Until the end of 2010, intra-ASEAN trade was still low as trade involved mainly exports to countries outside the region, with the exception of Laos and Myanmar, whose foreign trade was ASEAN-oriented.[109] In 2009, realised foreign direct investment (FDI) was US$37.9 billion and increased two-fold in 2010 to US$75.8 billion.
The ASEAN Framework Agreement on Trade in Services (AFAS) was adopted at the ASEAN Summit in Bangkok in December 1995.[110] Under the agreement, member states enter into successive rounds of negotiations to liberalise trade in services with the aim of submitting increasingly higher levels of commitment. ASEAN has concluded seven packages of commitments under AFAS.[111]
Mutual Recognition Agreements (MRAs) have been agreed upon by ASEAN for eight professions: physicians, dentists, nurses, architects, engineers, accountants, surveyors, and tourism professionals. Individuals in these professions will be free to work in any ASEAN states effective 31 December 2015.[112][113][114]
In addition, six member states (Malaysia, Vietnam (2 exchanges), Indonesia, Philippines, Thailand, and Singapore) have collaborated on integrating their stock exchanges, which includes 70% of its transaction values with the goal to compete with international exchanges.[115]
Single market will also include the ASEAN Single Aviation Market (ASEAN-SAM), the region's aviation policy geared towards the development of a unified and single aviation market in Southeast Asia. It was proposed by the ASEAN Air Transport Working Group, supported by the ASEAN Senior Transport Officials Meeting, and endorsed by the ASEAN Transport Ministers.[116] It is expected to liberalise air travel between member states allowing ASEAN airlines to benefit directly from the growth in air travel, and also free up tourism, trade, investment, and service flows.[116][117] This policy supersedes existing unilateral, bilateral, and multilateral air services agreements among member states which are inconsistent with its provisions.
Japan edit
Indonesia and Japan signed the Indonesia–Japan Economic Partnership Agreement (IJEPA), which had come into effect on 1 July 2008. The agreement was Indonesia's first bilateral free-trade agreement to ease the cross-border flow of goods and people as well as investment between both countries.[118] In 2012, there were between 1,200 and 1,300 Japanese corporates operating in Indonesia, with some 12,000 Japanese nationals living in Indonesia. Japan has been investing in Indonesia for decades, particularly in the automotive, electronic goods, energy, and mining sectors. Prior to the formation of the Indonesian Republic, the Japanese had viewed Indonesia as an important source of natural resources. The Japanese need of natural resources was among the reasons that led the nation to advance further to the south in their military conquests during World War II. Today Indonesia is Japan's major supplier for natural rubber, liquefied natural gas, coal, minerals, paper pulp, seafood such as shrimp and tuna, and coffee. Traditionally Indonesia has been regarded as a major market of Japanese automotive and electronic goods. For Japanese businesses, Indonesia has been a location for low-cost manufacturing operations as well as being the source of various natural resources required by those operations. Approximately 1,000 Japanese companies operate in Indonesia which employ approximately 300,000 people.[119] Major Japanese factories are concentrated east of Jakarta with high concentrations in Bekasi, Cikarang and Karawang, West Java.
China edit
Trade with China has increased since the 1990s, and in 2014, China became Indonesia's second-largest export destination after Japan.[120] Trade between China and Indonesia is on the rise, especially after the implementation of ACFTA since early 2010. Indeed, while in 2003 trade between Indonesia and China reached only US$3.8 billion, in 2010 it multiplied almost 10 times and reached US$36.1 billion.[121] China's transformation into Fastest growing country in the 21st century has led to an increase of foreign investments in the bamboo network, a network of overseas Chinese businesses operating in the markets of Southeast Asia that share common family and cultural ties.[122][123] However the free trade with China has caused much anxiety in Indonesia, since inflows of cheap products from China could harm Indonesian industry. Indonesian private sector and civil society organizations vigorously lobbied the Indonesian government and members of parliament, insisting that Indonesia should either pull out of the agreement or renegotiate its terms with Beijing.
China has remained on top of Indonesia's key major trading partners, serving as the country's largest export and import market. China serves as Indonesia's largest export destination after overtaking Japan and United States, reaching US$16.8 billion.[124][125][126] China is also Indonesia's most important source of imports, reaching US$30.8 billion, or 22.7% of Indonesian imports in 2016.[127] The balance however was in favour of China as Indonesia booked a trade deficit of US$14 billion in 2016.[128]
From China's perspective, since 2010 ASEAN as a whole has become its fourth-largest trading partner after the European Union, Japan and the United States. Among ASEAN member countries, Indonesia was China's fourth-largest trading partner, which, according to data as of May 2010 from the Ministry of Commerce of the People's Republic of China, amounted to US$12.4 billion, after Malaysia (US$22.2 billion), Singapore (US$17.9 billion) and Thailand (US$15.7 billion).[121] With China's economic rise, Indonesia has been intensifying its trade relationship with China to counterbalance its ties with the West.[129] By 2020, China had become Indonesia's largest export destination.[130]
South Korea edit
In the past, the relations were only developed around trade and investments, such as the forestry and garment sectors. Today the cooperation has been expanded to a number of mega projects and advanced industries. With US$27 billion in bilateral trade, South Korea became the fourth biggest trading partner of Indonesia in 2012. It became the third-biggest foreign investor in Indonesia, with US$1.94 billion in investment.
There are large numbers of South Korean companies that have been investing and operating in Indonesia, such as Miwon (Daesang Corporation), Lotte, Yong Ma, Hankook Tire, Samsung, LG, Kia Motors, and Hyundai. In 2011, Hankook announced a US$353 million investment into a production plant located in Bekasi, West Java, Indonesia.[131]
In 2019, trade between Indonesia and South Korea was worth $15.65 billion, and between 2015 and 2019 South Korean companies invested nearly $7 billion in Indonesia. In December 2020, Indonesia and South Korea signed a comprehensive economic partnership. It is equivalent to a free trade agreement, though focuses on a broader scope of economic cooperation. Under the deal, Indonesia will scrap 94.8% of tariffs on South Korean products while South Korea will scrap 95.8% of tariffs on Indonesian products.[132][133][134]
United States edit
At the beginning of the post-Suharto era, US exports to Indonesia in 1999 totaled $2 billion, down significantly from $4.5 billion in 1997. The main exports were construction equipment, machinery, aviation parts, chemicals, and agricultural products. US imports from Indonesia in 1999 totaled $9.5 billion and consisted primarily of clothing, machinery and transportation equipment, petroleum, natural rubber, and footwear. Financial assistance to Indonesia is coordinated through the Consultative Group on Indonesia (CGI) formed in 1989. It includes 19 donor countries and 13 international organizations that meet annually to coordinate donor assistance. In 2019, as Indonesia's share of global trade exceeded 0.5 percent, the United States Trade Representatives decided not to classify Indonesia as a "developing country."[135] Despite a revocation of this status, the Indonesian government has assured that this would not change the current Generalized System of Preferences facilities that Indonesia had enjoyed from the United States.[136]
European Union edit
The EU and Indonesia have built robust commercial relations, with bilateral trade amounting to approximately €25 billion in 2012 resulting in a sizeable €5.7 billion trade surplus for Indonesia with the EU. In the past few years trade between EU and Indonesia has been marked by an upward trend. Whereas total trade was worth almost €16 billion in 2009, by 2011 it had already reached €23.5 billion. For the EU, Indonesia is the 24th largest import source (share 0.9%) and the 30th largest export destination (share 0.6%). Inside the ASEAN-region, Indonesia ranks fourth in terms of total trade. The EU is Indonesia's 4th largest trading partner after Japan, China and Singapore, representing almost 10% of its total external trade. The EU is the second largest investor in the Indonesian economy.[137] Indonesia mostly exports to the EU agricultural products and processed resources, mainly palm oil, fuels and mining products, textiles and furniture. EU exports to Indonesia consist mainly of high-tech machinery and transport equipment, chemicals and various manufactured goods. Essentially, trade flows between Indonesia and the EU complement each other.[137] After negotiations on a free trade agreement with ASEAN got increasingly difficult, the EU began pursuing negotiations with individual ASEAN states. The EU and Indonesia are currently working towards an ambitious Comprehensive Economic Partnership Agreement covering trade, investment and services.[138]
India edit
On 25 January 2011, after talks by Indian Prime Minister Manmohan Singh and visiting President of Indonesia Susilo Bambang Yudhoyono, India and Indonesia had signed business deals worth billions of dollars and set an ambitious target of doubling trade over the next five years.[139] India also has further economic ties with Indonesia through its free trade agreement with ASEAN, of which Indonesia is a member.[140] The two countries target to achieve bilateral trade of $25 billion by 2015, with cumulative Indian investments of $20 billion in Indonesia.[141]
Free trade efforts edit
International trade agreements edit
| Economy | Agreement | Abbreviation | Concluded | Signed | Effective | Legal
Text |
|---|---|---|---|---|---|---|
| Indonesia–Australia Comprehensive Economic Partnership Agreement | IACEPA | November 2010 | March 2019 | February 2020 | [1] | |
| Chile–Indonesia Comprehensive Economic Partnership Agreement | CICEPA | May 2014 | December 2017 | August 2019 | [2] | |
| Indonesia–EFTA Comprehensive Economic Partnership Agreement | IECEPA | |||||
| Indonesia–Iran Preferential Trade Agreement | IIPTA | |||||
| Indonesia–Japan Economic Partnership Agreement | IJEPA | 20 August 2007 | 20 August 2007 | 1 July 2008 | [3] Archived 13 January 2023 at the Wayback Machine | |
| Indonesia–Korea Comprehensive Economic Partnership Agreement | IKCEPA | |||||
| Indonesia–Mozambique Preferential Trade Agreement | IMPTA | April 2018 | August 2019 | December 2021 | [4] Archived 13 January 2023 at the Wayback Machine | |
| Indonesia–Pakistan Preferential Trade Agreement | IPPTA | November 2005 | 3 February 2012 | September 2013 | [5] | |
| Indonesia–Palestine Trade Facilitation for Certain Products | ||||||
| Indonesia–UAE Comprehensive Economic Partnership Agreement | IUAECEPA | |||||
| ASEAN–China Free Trade Area | ACFTA | November 2002 | 1 January 2010 | [6] | ||
| ASEAN–Hong Kong, China Free Trade Area | AHKFTA | 12 November 2017 | 13 October 2019 | [7] | ||
| ASEAN–India Free Trade Area | AIFTA | 13 August 2009 | 1 January 2010 | [8] | ||
| ASEAN–Japan Comprehensive Economic Partnership | AJCEP | 14 April 2008 | 1 February 2009 | [9] | ||
| ASEAN–Korea Free Trade Area | AKFTA | 1 January 2010 | [10] | |||
| ASEAN–Australia–New Zealand Free Trade Area | AANZFTA | 27 February 2009 | 1 January 2010 | [11] | ||
| Regional Comprehensive Economic Partnership | RCEP | 20 November 2012 | 3 November 2022 | 3 November 2022 | [12] |
Macro-economic trend edit
This is a chart of trend of Indonesia's GDP at market prices[142] by the IMF with figures in millions of rupiah.
| Year | GDP | USD exchange (rupiah) |
Inflation rate (%) | Nominal GDP per capita (as % of US) |
GDP PPP per capita (as % of US) |
|---|---|---|---|---|---|
| 1980 | 60,143.191 | 627 | 18.0 | 3.90 | 5.93 |
| 1985 | 112,969.792 | 1,111 | 4.7 | 2.82 | 5.98 |
| 1990 | 233,013.290 | 1,843 | 7.8 | 2.45 | 12.90 |
| 1995 | 502,249.558 | 2,249 | 9.4 | 3.57 | 15.76 |
| 2000 | 1,389,769,700 | 8,396 | 3.8 | 2.15 | 13.05 |
| 2005 | 2,678,664,096 | 9,705 | 10.5 | 2.86 | 14.17 |
| 2010 | 6,422,918,230 | 8,555 | 5.1 | 6.44 | 17.54 |
| 2015 | 11,531,700,000 | 13,824 | 6.4 | 5.86 | 18.02 |
| 2020 | 15,434,200,000 | 14,105 | 1.7 | 6.35 | 18.89 |
For purchasing power parity comparisons, the exchange rate for 1 US dollar is set at 3,094.57 rupiah.
Average net wage in Indonesia varies by sector. In February 2017 the electricity, gas, and water sector has the highest average net wage, while the agriculture sector has the lowest.[143]
Investment edit

Since the late 1980s, Indonesia has made significant changes to its regulatory framework to encourage economic growth. This growth was financed mostly from private investment, both foreign and domestic. US investors dominated the oil and gas sector and undertook some of Indonesia's largest mining projects. In addition, the presence of US banks, manufacturers, and service providers expanded, especially after the industrial and financial sector reforms of the 1980s. Other major foreign investors included India, Japan, the UK, Singapore, the Netherlands, Qatar, Hong Kong, Taiwan and South Korea.
The 1997 crisis made continued private financing imperative but problematic. New foreign investment approvals fell by almost two-thirds between 1997 and 1999. The crisis further highlighted areas where additional reform was needed. Frequently cited areas for improving the investment climate were the establishment of a functioning legal and judicial system, adherence to competitive processes, and adoption of internationally acceptable accounting and disclosure standards. Despite improvements of laws in recent years, Indonesia's intellectual property rights regime remains weak, and lack of effective enforcement is a significant concern. Under Suharto, Indonesia had moved towards the private provision of public infrastructure, including electric power, toll roads, and telecommunications. The 1997 crisis brought to light a severe weakness in the process of dispute resolution, however, particularly in the area of private infrastructure projects. Although Indonesia continued to have the advantages of a large labour force, abundant natural resources and modern infrastructure, private investment in new projects largely ceased during the crisis.
As of 28 June 2010, the Indonesia Stock Exchange had 341 listed companies with a combined market capitalization of $269.9 billion.[144] As of November 2010, two-thirds of the market capitalization was in the form of foreign funds, and only around 1% of the population have stock investments.[145] Efforts are further being made to improve the business and investment environment. Within the World Bank's Doing Business Survey,[146] Indonesia rose to 122 out of 178 countries in 2010, from 129 in the previous year. Despite these efforts, the rank is still below regional peers, and an unfavorable investment climate persists. For example, potential foreign investors and their executive staff cannot maintain their own bank accounts in Indonesia, unless they are tax-paying local residents (paying tax in Indonesia for their worldwide income).[citation needed]
From 1990 to 2010, Indonesian companies have been involved in 3,757 mergers and acquisitions as either acquirer or target with a total known value of $137 billion.[147] In 2010, 609 transactions were announced, which is a new record. Numbers had increased by 19% compared to 2009. The value of deals in 2010 was US$17 billion, which is the second-highest number ever. In 2012, Indonesia realized total investments of $32.5 billion, surpassing its annual target $25 billion, as reported by Investment Coordinating Board (BKPM) on 22 January. The primary investments were in the mining, transport and chemicals sectors.[148] In 2011, the Indonesian government announced a new Masterplan (known as the MP3EI, or Masterplan Percepatan dan Perluasan Pembangunan Ekonomi Indonesia, the Masterplan to Accelerate and Expand Economic Development in Indonesia). The aim was to encourage increased investment, particularly in infrastructure projects across Indonesia.[149]
Indonesia regained its investment grade rating from Fitch Rating in late 2011, and from Moody's Rating in early 2012, after losing it in the 1997 crisis, during which Indonesia spent more than Rp. 450 trillion ($50 billion) to bail out lenders from banks.[citation needed] Fitch raised Indonesia's long-term and local currency debt rating to BBB− from BB+ with both ratings is stable. Fitch also predicted that the economy would grow at least 6% on average per year through 2013, despite a less conducive global economic climate. Moody's raised Indonesia's foreign and local currency bond ratings to Baa3 from Ba1 with a stable outlook.[150] In May 2017, S&P Global raised Indonesia's investment grade from BB+ to BBB− with a stable outlook, due to the economy experiencing a rebound in exports and strong consumer spending during early 2017.[151]
Foreign Direct Investment (FDI) edit
Indonesia's foreign direct investment surged 44.2% on a yearly basis in 2022, with the base metals sector drawing in the biggest inflows. Indonesia's received 654.4 trillion rupiah worth of FDI last year, or equivalent to $45.6 billion in the investment ministry's official calculation, which assumes an exchange rate of 14,350 to the dollar. The data excludes investment in the banking and oil and gas sectors. Foreign direct investment in base metals and mining reached $11 billion and $5.1 billion, respectively, last year, the biggest recipients of FDI. The biggest sources were Singapore, China and Hong Kong. Total investment, including from domestic sources, reached 1,207.2 trillion rupiah ($81.02 billion), roughly in line with the government's target. FDI in the final quarter of last year was up 43.3% on an annual basis, amounting to 175.2 trillion rupiah in rupiah terms, or $12.2 billion in the official U.S. dollar equivalent.[152]
List of the 10 largest foreign investment origin countries in Indonesia in 2022:[153]
1. Singapore: $10.54 billion
2. China: $5.18 billion
3. Hong Kong, PRC: $3.91 billion
4. Japan: $2.76 billion
5. Malaysia: $2.21 billion
6. United States: $2.12 billion
7. South Korea: $1.66 billion
8. Netherlands: $1.09 billion
9. Bermuda: $0.76 billion
10. UK: $0.51 billion
Foreign direct investment into Indonesia (excluding investment in banking and the oil and gas sectors) increased 20.2 percent year-on-year to a new record peak of IDR 177 trillion (US$11.96 billion) in the Q1 of 2023, amid efforts by the government to ease business and licensing rules. Singapore (US$4.3 billion) was the biggest source of investment, followed by Hong Kong (US$1.5 billion), China (US$1.2 billion), and Japan (US$1 billion) while base metals were the biggest recipient amid efforts to boost investment in processed minerals. In total, Indonesia recorded IDR 328.9 trillion of foreign and domestic investment during the first quarter, up 16.5 percent from a year earlier, boosted by a rise in investment in base metals, transportation, and the mining sector. For 2023, the government has set a target to draw IDR 1,400 trillion (US$95.5 billion) of investment from domestic and foreign sources.[154]
Largest public Indonesian companies edit
Fortune Global 500 edit
Indonesia has 1 company that rank in the Fortune Global 500 ranking for 2022.[155]
| World Rank | Company | Industry | Sales ($M) | Profits ($M) | Assets ($M) | Employees |
|---|---|---|---|---|---|---|
| 223 | Pertamina | Oil and gas | 57,508 | 2,045 | 78,050 | 34,183 |
Forbes Global 2000 edit
Indonesia has 7 companies that rank in the Forbes Global 2000 ranking for 2022.[156]
| World Rank | Company | Industry | Sales (billion $) |
Profits (billion $) |
Assets (billion $) |
Market Value (billion $) |
|---|---|---|---|---|---|---|
| 351 | Bank Rakyat Indonesia | Banking | 12.77 | 2.17 | 117.74 | 50.14 |
| 490 | Bank Mandiri | Banking | 9.53 | 1.96 | 121.09 | 26.88 |
| 518 | Bank Central Asia | Banking | 6.10 | 2.26 | 87.69 | 67.62 |
| 895 | Telkom Indonesia | Telecom | 10.02 | 1.73 | 19.45 | 31.88 |
| 1153 | Bank Negara Indonesia | Banking | 4.82 | 0.76 | 67.7 | 12.13 |
| 1749 | Bayan Resources | Mining | 2.85 | 1.21 | 2.43 | 9.82 |
| 1866 | Saratoga Investama Sedaya | Conglomerate/Investment | 0.12 | 1.74 | 4.29 | 3.38 |
Public expenditure edit
In 2015, total public spending was Rp 1,806 trillion (US$130.88 billion, 15.7% of GDP). Government revenues, including those from state-owned enterprises (BUMN), totaled Rp 1,508 trillion (US$109.28 billion, 13.1% of GDP) resulting in a deficit of 2.6%.[157] Since the 1997 crisis that caused an increase in debt and public subsidies and a decrease in development spending, Indonesia's public finances have undergone a major transformation. As a result of a series macroeconomic policies, including a low budget deficit, Indonesia is considered to have moved into a situation of financial resources sufficiency to address development needs. Decentralization, enacted during the Habibie administration, has changed the manner of government spending, which has resulted in around 40% of public funds being transferred to regional governments by 2006.
In 2005, rising international oil prices led to the government's decision of slashing fuel subsidies. It led to an extra US$10 billion for government spending on development,[158] and by 2006, there were an additional 5 billion due to steady growth, and declining debt service payments.[158] It was the country's first "fiscal space" since the revenue windfall during the 1970s oil boom. Due to decentralization and fiscal space, Indonesia has the potential to improve the quality of its public services. Such potential also enables the country to focus on further reforms, such as the provision of targeted infrastructure. Careful management of allocated funds has been described as Indonesia's main issue in public expenditure.[158][159]
In 2018, President Joko Widodo substantially increased the amount of debt by taking foreign loans. Indonesia has increased the debt by Rp 1,815 trillion compared to his predecessor, SBY. He has insisted that the loan is used for productive long-term projects such as building roads, bridges, and airports.[160] Finance Minister Sri Mulyani also stated that despite an increase of foreign loans and debt, the government has also increased the budget for infrastructure development, healthcare, education, and budget given to regencies and villages.[161] The government is insisting that foreign debt is still under control, and complying with relevant laws that limit debt to be under 60% of GDP.[162]
Regional performance edit
Based on the regional administration implementation performance evaluation of 2009, by order, the best performance were:
- 3 provinces: North Sulawesi, South Sulawesi , and Central Java;
- 10 regencies: Jombang, Bojonegoro and Pacitan in East Java Province, Sragen in Central Java, Boalemo in Gorontalo, Enrekang in South Sulawesi, Buleleng in Bali, Luwu Utara in South Sulawesi, Karanganyar in Central Java, and Kulon Progo in Yogyakarta;
- 10 cities: Surakarta and Semarang in Central Java, Banjar in West Java, Yogyakarta city in Yogyakarta, Cimahi in West Java, Sawahlunto in West Sumatra, Probolinggo and Mojokerto in East Java, and Sukabumi and Bogor in West Java.[163]
Based on JBIC Fiscal Year 2010 survey (22nd Annual Survey Report) found that in 2009, Indonesia has the highest satisfaction level in net sales and profits for Japanese companies.[164]
Wealth edit

National net wealth edit
National net wealth, also known as national net worth, is the total sum of the value of a nation's assets minus its liabilities. It refers to the total value of net wealth possessed by the citizens of a nation at a set point in time.[165] This figure is an important indicator of a nation's ability to take on debt and sustain spending and is influenced not only by real estate prices, equity market prices, exchange rates, liabilities and incidence in a country of the adult population but also by human resources, natural resources and capital and technological advancements, which may create new assets or render others worthless in the future. According to Credit Suisse, Indonesia has national net wealth of approximately $3.199 trillion, or about 0.765% of world net wealth, placing Indonesia at 17th, above Russia, Brazil, and Sweden.[166]
High-net-worth individuals edit
According to Asia Wealth Report, Indonesia has the highest growth rate of high-net-worth individuals (HNWI) predicted among the 10 largest Asian economies.[167] The 2015 Knight Frank Wealth Report reported that in 2014 there were 24 individuals with a net worth above US$1 billion. 18 of them lived in Jakarta while the others were spread among other large cities in Indonesia. 192 persons can be categorized as centamillionaires with over US$100 million of wealth and 650 persons as high-net-worth individuals whose wealth exceeded US$30 million.[168]
Challenges edit
Embezzlement and corrupt bureaucracy edit

Corruption is pervasive in the Indonesian government, affecting many fields that are central to barrier the country's economic development from local governments, the police, the private sector even various ministerial institutions which are close to the president.[169][170] It is related to problems of human capacities and technical resources remains a major challenge in merging effectiveness and integrity in public administration, especially in regencies and cities.[171] A 2018 World Economic Forum survey reports that corruption is the most problematic issue regarding doing business in Indonesia, as well as inefficient government bureaucracy policies. The survey also showed that 70% of entrepreneurs believe that corruption has grown in Indonesia, while low trust in the private sector is a major obstacle to foreign investment in the country.[172]
In 2019, a controversial bill regarding the anti-corruption body (Corruption Eradication Commission (KPK)) reduced the commission's effectiveness in tackling widespread corruption problems and stripped its independence was passed despite massive protests across the country.[173][174] There were 26 points in the revised law that crippled the commission and might further undermine efforts to eradicate corruption in Indonesia.[175]
Labour unrest edit
As of 2011, labour militancy was growing with a major strike at the Grasberg mine, the world's largest gold mine as well as the second-largest copper mine,[176] and numerous strikes elsewhere. A common issue was the attempts by foreign-owned enterprises to evade Indonesia's strict labour laws by calling their employees' contract workers. The New York Times expressed concern that Indonesia's cheap labor advantage might be lost. However, a large pool of the unemployed who will accept substandard wages and conditions remains available. One factor in the increase of militancy is increased awareness via the Internet of prevailing wages in other countries, and the generous profits foreign companies are making in Indonesia.[177]
On 1 September 2015, thousands of workers in Indonesia staged large demonstrations across the country in pursuit of higher wages and improved labour laws. Approximately 35,000 people rallied in total. They demanded a 22% to 25% increase in the minimum wage by 2016 and lower prices on essential goods, including fuel. The unions also want the government to ensure job security and ensure the fundamental rights of the workers.[178]
In 2020, thousands of workers across the country held a massive march to protest against the Omnibus Law on Job Creation that included several controversial rules, which revised minimum wages, lowered severance pay, relaxed firing rules, among other disadvantaging regulations for labors and factory workers.[179][180][181]
Inequality edit
Economic disparity and the flow of natural resource profits to Jakarta has led to discontent and contributed to separatist movements in areas such as Aceh and Papua. Geographically, the poorest fifth regions account for just 8% of consumption, while the wealthiest fifth account for 45%. While there are new laws on decentralization that may address the problem of uneven growth and satisfaction partially, there are many hindrances in putting this new policy into practice.[182] At a 2011 Makassar Indonesian Chamber of Commerce and Industry (Kadin) meeting, Disadvantaged Regions Minister said there are 184 regencies classified as disadvantaged areas, with around 120 in eastern Indonesia.[183] 1% of Indonesia's population has 49.3% of the country's $1.8 trillion wealth, down from 53.5%. However, it is ranked fourth after Russia (74.5%), India (58.4%) and Thailand (58%).[184]
Inflation edit
Inflation has long been a problem in Indonesia. Because of political turmoil, the country once suffered hyperinflation, with 1,000% annual inflation between 1964 and 1967,[185] resulting in severe poverty and hunger.[186] Even though the economy recovered quickly during the first decade of the New Order administration (1970–1981), never once was the inflation less than 10% annually. The inflation slowed during the mid-1980s; however, the economy was also languid due to the decrease in oil price that reduced its export revenue dramatically. The economy was again experiencing rapid growth between 1989 and 1997 due to the improving export-oriented manufacturing sector. Still, the inflation rate was higher than economic growth, and this caused a widening gap among Indonesians. Inflation peaked in 1998 during the 1997 crisis at over 58%, causing poverty to rise to the levels of the 1960s.[187] During the economic recovery and growth in recent years, the government has been trying to lower the inflation rate. However, it seems that inflation has been affected by global fluctuation and domestic market competition.[188] As of 2010, the inflation rate was approximately 7%, when its economic growth was 6%. To date, inflation is affecting the Indonesian lower middle class, especially those who are not able to afford food after price hikes.[189][190] At the end of 2017, Indonesia's inflation rate was 3.61%, or higher than the government-set forecast of 3.0–3.5%.[191]
See also edit
- Alcohol in Indonesia
- Bamboo network
- CIVETS countries
- COVID-19 pandemic in Indonesia
- Indonesia Stock Exchange
- Developing 8 Countries
- European Union-Indonesia trade relations
- G-20 major economies
- G20 developing nations
- Gas subsidies
- List of main infrastructure projects in Indonesia
- List of largest companies in Indonesia
- Next Eleven
- Science and technology in Indonesia
- Taxation in Indonesia
- Tourism in Indonesia
References edit
- ^ "World Economic Outlook Database, April 2019". IMF.org. International Monetary Fund. Retrieved 29 September 2019.
- ^ "World Bank Country and Lending Groups". World Bank. Retrieved 1 July 2023.
- ^ "Indonesian Population June 2023". Ministry of Home Affairs (Indonesia). Retrieved 28 October 2023.
- ^ a b c d "World Economic Outlook Database, April 2024". IMF.org. International Monetary Fund. Retrieved 19 April 2024.
- ^ "WORLD ECONOMIC OUTLOOK 2022 OCT Countering the Cost-of-Living Crisis". www.imf.org. International Monetary Fund. p. 43. Retrieved 11 October 2022.
- ^ "Ekonomi Indonesia Tahun 2022 Tumbuh 5,31 Persen". BPS.go.id. Badan Pusat Statistik. 6 February 2023. Retrieved 8 August 2023.
- ^ "Ekonomi Indonesia Triwulan IV-2023 Tumbuh 5,04 Persen (y-on-y)". BPS.go.id. Badan Pusat Statistik. 5 February 2024. Retrieved 20 April 2024.
- ^ a b c d "CIA World Factbook". CIA.gov. Central Intelligence Agency. Retrieved 13 January 2019.
- ^ "INDONESIA INFLATION APRIL 2024". www.bps.go.id. Retrieved 9 May 2024.
- ^ "worldpoverty 2021". worldpoverty.[verification needed]
- ^ a b c d "Poverty and Inequality Platform". pip.worldbank.org. Retrieved 17 May 2022.
- ^ a b "Profil Kemiskinan di Indonesia Maret 2023". Badan Pusat Statistik. 17 July 2023. Retrieved 29 July 2023.
- ^ "Poverty and Inequality Indicators". pip.worldbank.org. Retrieved 19 April 2024.
- ^ a b "Human Development Index 2023/24" (PDF). hdr.undp.org. United Nations Development Programme. Retrieved 13 March 2024.
- ^ "Labor force, total - Indonesia". data.worldbank.org. World Bank. Retrieved 2 July 2021.
- ^ "Employment to population ratio, 15+, total (%) (national estimate) - Indonesia". data.worldbank.org. World Bank. Retrieved 2 July 2021.
- ^ "Indonesia : Distribution of employment by economic sector from 2010 to 2020". statista.com. Statista. Retrieved 4 July 2021.
- ^ "Report for Selected Countries and Subjects". IMF.org. International Monetary Fund. Retrieved 19 April 2022.
- ^ a b c d "Ekspor Desember 2023 mencapai US$22,41 miliar, naik 1,89 persen dibanding November 2023 dan Impor Desember 2023 senilai US$19,11 miliar, turun 2,45 persen dibanding November 2023". www.bps.go.id/. Retrieved 31 March 2024.
- ^ "Indonesia Foreign Debt 2023". bi.go.id. Retrieved 6 September 2023.
- ^ "Indonesia's External Debt Growth in Q3/2021 Remained Manageable". www.bi.go.id. Retrieved 2 December 2021.
- ^ a b "Report for Selected Countries and Subjects". IMF.org. International Monetary Fund. Retrieved 19 April 2024.
- ^ "Realisasi Pendapatan Negara 2021". Retrieved 17 January 2022.
- ^ "Japan Credit Racing Agency News Release" (PDF). Archived (PDF) from the original on 16 May 2021.
- ^ "Indonesia | Japan Credit Rating Agency, LTD. - JCR".
- ^ "Indonesia | Japan Credit Rating Agency, LTD. - JCR".
- ^ a b "Indonesia Credit Rating". World Government Bonds. Retrieved 19 May 2020.
- ^ "Fitch Affirms Indonesia at 'BBB'; Outlook Stable". Retrieved 8 December 2020.
- ^ "FOREIGN EXCHANGE RESERVES IN DECEMBER 2023". Retrieved 13 January 2024.
- ^ Kim, Kyunghoon (2021). "Indonesia's Restrained State Capitalism: Development and Policy Challenges". Journal of Contemporary Asia. 51 (3): 419–446. doi:10.1080/00472336.2019.1675084. S2CID 211395480.
- ^ Kim, Kyunghoon (2023). "Key Features of Indonesia's State Capitalism Under Jokowi". Jas (Journal of Asean Studies). 10 (2). doi:10.21512/jas.v10i2.9075.
- ^ "G20 Presidency of Indonesia". Retrieved 27 June 2022.
- ^ "Indonesia Accounts for 40% Digital Transaction Value in ASEAN". Indonesia.go.id. Retrieved 27 August 2023.
- ^ "Kemenperin – Ketika Swasta Mendominasi". Archived from the original on 5 August 2017.
- ^ "80 Persen Industri Indonesia Disebut Dikuasai Swasta". 3 March 2015.
- ^ "Kemenperin – Pengelola Kawasan Industri Didominasi Swasta". Archived from the original on 5 August 2017. Retrieved 5 August 2017.
- ^ "Acicis – Dspp". Acicis.murdoch.edu.au. Retrieved 29 August 2011.
- ^ "GDP growth (annual %)". data.worldbank.org. Retrieved 5 August 2017.
- ^ "Why Indonesia's Apparent Stability Under Jokowi Is a Sign of Its Stagnation". worldpoliticsreview.com. 21 October 2016. Retrieved 6 May 2020.
- ^ "Pertumbuhan Ekonomi 2020 -2,07% Terburuk Sejak Krismon 98". CNBC Indonesia (in Indonesian). Retrieved 5 February 2021.
- ^ "Beating expectations, Indonesia's economy grows 5 percent in Q4". www.aljazeera.com. Retrieved 31 March 2022.
- ^ "Indonesia Will be World's 4th Largest Economy by 2045, President Jokowi Says". Sekretariat Kabinet Republik Indonesia. 27 March 2017. Archived from the original on 27 June 2017. Retrieved 25 May 2021.
- ^ Lindblad, J. Thomas (2006). "Macroeconomic consequences of decolonization in Indonesia" (PDF). XIVth Conference of the International Economic History Association. Helsinki. Archived from the original (PDF) on 11 August 2013. Retrieved 18 August 2017.
- ^ "History – BNI". BNI. Archived from the original on 1 July 2018. Retrieved 18 August 2017.
- ^ Hakiem, Lukman (9 August 2017). "Hatta-Sjafruddin: Kisah Perang Uang di Awal Kemerdekaan" (in Indonesian). Republika. Retrieved 18 August 2017.
- ^ Lindblad, J. Thomas (2004). "From Java Bank to Bank Indonesia: A Case Study of Indonesianisasi in Practice" (PDF). Archived from the original (PDF) on 27 March 2009.
{{cite journal}}: Cite journal requires|journal=(help)
Lindblad, J. Thomas (2004). "Van Javasche Bank naar Bank Indonesia. Voorbeeld uit de praktijk van indonesianisasi". Tijdschrift voor Sociale en Economische Geschiedenis (in Dutch). 1: 28–46. - ^ van de Kerkhof, Jasper (March 2005). "Dutch enterprise in independent Indonesia: cooperation and confrontation, 1949–1958" (PDF). IIAS Newsletter. 36. Archived from the original (PDF) on 18 August 2017. Retrieved 18 August 2017.
- ^ "Period of Recognition of the Republic of Indonesia's Sovereignty up the Nationalization of DJB" (PDF). Special Unit for Bank Indonesia Museum: History Before Bank Indonesia. Archived from the original (PDF) on 5 October 2019. Retrieved 18 August 2017 – via Bank Indonesia.
- ^ "Sukarno's economic policy left me on the brink of ruin: Mochtar Riady's story (13)". Nikkei Asia. Retrieved 19 March 2023.
- ^ Baten, Jörg (2016). A History of the Global Economy. From 1500 to the Present. Cambridge University Press. p. 292. ISBN 9781107507180.
- ^ a b c Schwarz (1994), pp. 52–7.
- ^ "Indonesia: Country Brief". Indonesia: Key Development Data & Statistics. The World Bank. September 2006.
- ^ "GDP info". Earthtrends.wri.org. Archived from the original on 20 February 2009. Retrieved 29 August 2011.
- ^ "Combating Corruption in Indonesia, World Bank 2003" (PDF). Archived from the original (PDF) on 21 January 2005. Retrieved 29 August 2011.
- ^ "Transparency International Global Corruption Report 2004". Transparency.org. Archived from the original on 2 September 2011. Retrieved 29 August 2011.
- ^ "Suharto tops corruption rankings". BBC News. 25 March 2004. Retrieved 29 August 2011.
- ^ Robison, Richard (17 November 2009). "A Slow Metamorphosis to Liberal Markets". Australian Financial Review.
- ^ "Historical Exchange Rates". OANDA. 16 April 2011. Retrieved 29 August 2011.
- ^ "XE: USD / IDR Currency Chart. US Dollar to Indonesian Rupiah Rates". xe.com. Retrieved 6 May 2020.
- ^ van der Eng, Pierre (4 February 2002). "Indonesia's growth experience in the 20th century: Evidence, queries, guesses" (PDF). Australian National University. Archived from the original (PDF) on 10 October 2017. Retrieved 10 October 2017.
- ^ Temple, Jonathan (15 August 2001). "Growing into trouble: Indonesia after 1966" (PDF). University of Bristol. Archived from the original (PDF) on 27 December 2016. Retrieved 27 December 2016.
- ^ BBC News (31 August 2005). "Indonesia plans to slash fuel aid". BBC, London.
- ^ "Beberapa Indikator Penting Mengenai Indonesia" (PDF) (Press release) (in Indonesian). Indonesian Central Statistics Bureau. 2 December 2008. Archived from the original (PDF) on 1 April 2008. Retrieved 18 March 2008.
- ^ "Indonesia: Economic and Social update" (PDF) (Press release). World Bank. 2008. Archived from the original (PDF) on 7 June 2011. Retrieved 2 April 2008.
- ^ "Indonesia: BPS-STATISTICS INDONESIA STRATEGIC DATA" (PDF) (Press release). BPS-Statistic Indonesia. 2009. Archived from the original (PDF) on 13 November 2010. Retrieved 5 November 2008.
- ^ "IMF Survey: Indonesia's Choice of Policy Mix Critical to Ongoing Growth". Imf.org. 28 July 2009. Retrieved 29 August 2011.
- ^ "Indonesian President Joko 'Jokowi' Widodo Two Years On". Time. Retrieved 7 May 2018.
- ^ "Jokowi Heads to 2018 With Backing of Stronger Indonesian Economy". Bloomberg.com. Retrieved 7 May 2018.
- ^ "Indonesian GDP Growth Disappoints, Adding to Currency Woes". Bloomberg.com. Retrieved 7 May 2018.
- ^ "Indonesian GDP growth falls short in 1Q, pressuring President Widodo". Nikkei Asian Review-GB. Retrieved 7 May 2018.
- ^ "World Economic Outlook (April 2020) - Unemployment rate". www.imf.org. Retrieved 4 July 2020.
- ^ "Report for Selected Countries and Subjects".
- ^ a b "Ekonomi Indonesia Triwulan IV-2023 Tumbuh 5,04 Persen (y-on-y)". BPS.go.id. Badan Pusat Statistik. 5 February 2024. Retrieved 5 February 2024.
- ^ Suryowati, Estu (12 August 2014). "Satu Dekade, Kontribusi Pertanian terhadap PDB Menurun". Kompas (in Indonesian).
- ^ "Pertanian di Indonesia (Agriculture in Indonesia)". Indonesia Investments. Retrieved 5 December 2015.
- ^ McClanahan, Paige (11 September 2013). "Can Indonesia increase palm oil output without destroying its forest?". The Guardian. Archived from the original on 17 September 2013. Retrieved 17 September 2013.
- ^ "Palm Oil". Greenpeace. Archived from the original on 26 September 2013. Retrieved 26 September 2013.
- ^ "Indonesia to replant 4.7m hectares of palm oil plantation". UkrAgroConsult. 30 August 2017. Archived from the original on 27 September 2017. Retrieved 27 September 2017.
- ^ "Fisheries Country Profile: Indonesia". Southeast Asian Fisheries Development Center. June 2018. Retrieved 24 April 2021.
- ^ "Member Countries". OPEC. Organisation of Petroleum Exporting Countries.
- ^ "Tigers count the cost of easing fuel subsidies". Asia Times. 10 March 2005. Archived from the original on 11 March 2005. Retrieved 29 August 2011.
{{cite web}}: CS1 maint: unfit URL (link) - ^ "Indonesia plans to slash fuel aid". BBC News. 31 August 2005.
- ^ "Coal Mining in Indonesia - Indonesian Coal Industry | Indonesia Investments". indonesia-investments.com. Retrieved 6 May 2020.
- ^ "Archived copy" (PDF). Archived from the original (PDF) on 15 November 2017. Retrieved 5 January 2016.
{{cite web}}: CS1 maint: archived copy as title (link) - ^ "Coal production may reach 370 million tons this year". 23 September 2011.
- ^ Sanderson, Henry (30 August 2019). "Nickel prices hit four-year high on Indonesia export ban". Financial Times. Archived from the original on 10 December 2022. Retrieved 9 September 2019.
- ^ "Indonesia emerges as world's second-largest cobalt producer". Financial Times. 9 May 2023. Retrieved 10 May 2023.
- ^ "RI aims to be second largest alumina producer". Antara News. 12 April 2011. Retrieved 29 August 2011.
- ^ "Economic nationalism is back in Indonesia as election approaches". The Straits Times. 17 September 2018. Retrieved 18 September 2018.
- ^ "Indonesia's Manufacturing Sector: Practical Information for Investors". Asean Briefing. 31 March 2020. Retrieved 1 July 2021.
- ^ "Manufacturing in Indonesia". Asia Link Business. Retrieved 1 July 2021.
- ^ Vakulchuk, R., Chan, H.Y., Kresnawan, M.R., Merdekawati, M., Overland, I., Sagbakken, H.F., Suryadi, B., Utama, N.A. and Yurnaidi, Z. 2020. Indonesia: how to boost investment in renewable energy. ASEAN Centre for Energy (ACE) Policy Brief Series, No. 6. https://www.researchgate.net/publication/341793782
- ^ Overland, Indra; Sagbakken, Haakon Fossum; Chan, Hoy-Yen; Merdekawati, Monika; Suryadi, Beni; Utama, Nuki Agya; Vakulchuk, Roman (December 2021). "The ASEAN climate and energy paradox". Energy and Climate Change. 2: 100019. doi:10.1016/j.egycc.2020.100019. hdl:11250/2734506. ISSN 2666-2787.
- ^ "Honda eyes larger share in premium bike market". The Jakarta Post. Retrieved 29 August 2011.
- ^ "Local automobile sales hit all-time high". 5 January 2012.
- ^ "Penjualan mobil capai 1,1 juta unit di 2012". 8 January 2013.
- ^ "Optimisme Ekspor Mobil Terus Menanjak". Archived from the original on 23 September 2015. Retrieved 22 September 2014.
- ^ "Roda dua makin ngacir ke luar negeri". 14 September 2015.
- ^ "2017 Production Statistics". Organisation Internationale des Constructeurs d'Automobiles. Retrieved 8 May 2018.
- ^ "Localization". PT. Toyota Motor Manufacturing Indonesia. Archived from the original on 29 June 2016. Retrieved 29 June 2016.
- ^ Office of Assistant to Deputy Cabinet Secretary for State Documents & Translation (25 April 2019). "Car Exports Expected to Increase 15.6% This Year". Archived from the original on 30 July 2020.
- ^ "Google to Open Indonesia Office 'Before 2012'". Embassyofindonesia.org. 22 July 2011. Archived from the original on 27 September 2011. Retrieved 29 August 2011.
- ^ "Internet penetration and the connected archipelago". 31 December 2011.
- ^ "Indonesia's State Assets Worth IDR1,338.7 Trillion". 2 January 2011. Archived from the original on 22 January 2012. Retrieved 2 January 2012.
- ^ "Siaran Pers: OJK Awasi 50 Konglomerasi Keuangan". 26 June 2015. Archived from the original on 1 July 2015. Retrieved 28 June 2015.
- ^ "Indonesia textile sector faces challenge". Investvine.com. 2 February 2013. Archived from the original on 28 December 2013. Retrieved 3 April 2013.
- ^ "Indonesia Among the World's Top 10 Remittance Receivers". Embassyofindonesia.org. 4 May 2011. Archived from the original on 27 September 2011. Retrieved 29 August 2011.
- ^ "After Malaysia, RI seeks similar pact with S. Arabia". The Jakarta Post. 19 August 2011. Retrieved 29 August 2011.
- ^ "ASEAN feared to become multinational companies market only". Anatara News. 10 November 2011. Archived from the original on 12 January 2012. Retrieved 10 November 2011.
- ^ "ASEAN Framework Agreement on Services (1995)". ASEAN. Archived from the original on 26 December 2009. Retrieved 21 December 2008.
- ^ "Overview". ASEAN. Archived from the original on 6 February 2011. Retrieved 21 December 2008.
- ^ Buranasomphop, Duangkamol (14 June 2014). "Asean 2015: Free movement of labour". AEC Tourism Thailand. Archived from the original on 18 May 2015. Retrieved 11 May 2015.
- ^ "Concern over free flow of labour after AEC starts". The Nation. 13 July 2014. Archived from the original on 18 May 2015. Retrieved 11 May 2015.
- ^ "Why the AEC in 2015 Will Lead to Few Changes in Thailand". Thai-Norwegian Chamber of Commerce. Archived from the original on 18 May 2015. Retrieved 12 May 2015.
- ^ Anna Suci Perwitasari (13 June 2012). "Indonesia belum akan masuk Asean Linkage". Archived from the original on 10 December 2014. Retrieved 17 January 2014.
- ^ a b "Asean Single Aviation Market". Straits Times. Singapore. 2 February 2008. Archived from the original on 9 December 2008. Retrieved 26 September 2008.
- ^ "Singaporean PM urges ASEAN to liberalise aviation". chinaview.cn. Xinhua News Agency. 1 November 2007. Archived from the original on 11 December 2008. Retrieved 26 September 2008.
- ^ "Indonesia-Japan Economic Partnership Agreement (IJEPA) Reviewed". indonesia-investments.com. Indonesia Investments. Retrieved 28 January 2018.
- ^ Huge opportunity from Japanese investment
- ^ "Indonesia". Archived from the original on 1 April 2017. Retrieved 20 November 2016.
- ^ a b Alexander C. Chandra and Lucky A. Lontoh (2011). "Indonesia – China Trade Relations: The deepening of economic integration amid uncertainty?" (PDF). International Institute for Sustainable Development. Archived from the original (PDF) on 10 June 2014. Retrieved 5 March 2013.
- ^ Quinlan, Joe (13 November 2007). "Insight: China's capital targets Asia's bamboo network". Financial Times. Archived from the original on 10 December 2022.
- ^ Murray L Weidenbaum (1 January 1996). The Bamboo Network: How Expatriate Chinese Entrepreneurs are Creating a New Economic Superpower in Asia. Martin Kessler Books, Free Press. pp. 4–8. ISBN 978-0-684-82289-1.
- ^ "China keen to work with Indonesia on BRI". The Straits Times. 10 February 2018.
- ^ "Trade Balance Indonesia: $678 Million Deficit in January 2018 | Indonesia Investments". www.indonesia-investments.com. Indonesia Investments.
- ^ "OEC - Indonesia (IDN) Exports, Imports, and Trade Partners". atlas.media.mit.edu. Archived from the original on 13 June 2019. Retrieved 30 June 2021.
- ^ "Top Indonesia Imports". www.worldsrichestcountries.com.
- ^ "Indonesia's Top Trading Partners". World's Top Exports. 26 December 2017.
- ^ "Indonesia forges stronger ties with China to boost economy". 19 November 2014. Retrieved 20 November 2016.
- ^ "Indonesia Posts Largest Trade Surplus Since 2011 as Coronavirus Disrupts Imports From China". Jakarta Globe. 16 March 2020. Retrieved 15 June 2020.
- ^ Rangga D Fadillah. "Hankook announces US$353 million investment". The Jakarta Post. Archived from the original on 24 January 2011.
- ^ "Indonesia, South Korea sign CEPA to boost trade, investment". The Jakarta Post. Retrieved 7 January 2021.
- ^ "S. Korea, Indonesia Sign CEPA". world.kbs.co.kr. Retrieved 7 January 2021.
- ^ "South Korea and Indonesia sign deal to boost trade, investment". Reuters. 18 December 2020. Retrieved 7 January 2021.
- ^ "USTR Updates List of Developing and Least-Developed Countries Under U.S. CVD Law | United States Trade Representative". ustr.gov. Retrieved 27 February 2020.
- ^ "Revocation of Indonesia's developing country status will not affect GSP: Government". The Jakarta Post. Retrieved 27 February 2020.
- ^ a b "Eurostat Home". Archived from the original on 24 January 2014. Retrieved 19 February 2014.
- ^ "Boosting EU-Indonesia relations".
- ^ "India and Indonesia aim to double trade". BBC News. 25 January 2011.
- ^ "India and Asean aim to boost trade". BBC News. 3 March 2011.
- ^ "Indian pushes for early economic accord with Indonesia". IANS. news.biharprabha.com. 24 April 2014. Retrieved 24 April 2014.
- ^ "Edit/Review Countries". Imf.org. 14 September 2006. Retrieved 29 August 2011.
- ^ "Indonesia: average net wage by sector 2017 | Statistic". Statista. Retrieved 28 January 2018.
- ^ Bloomberg Terminal
- ^ "Economy risks losing momentum: Experts". The Jakarta Post. 26 November 2010. Retrieved 29 August 2011.
- ^ "Doing Business Survey, World Bank". Doingbusiness.org. Retrieved 29 August 2011.
- ^ "Statistics on Mergers & Acquisitions (M&A)". Imaa-institute.org. Archived from the original on 6 January 2012. Retrieved 29 August 2011.
- ^ "Indonesia aims to boost FDI by 23%". Investvine.com. 24 January 2013. Archived from the original on 23 October 2013. Retrieved 26 January 2013.
- ^ A copy of the Masterplan is available at the website of the Indonesian Coordinating Ministry for Economic Affairs. Archived 8 September 2012 at the Wayback Machine.
- ^ "Moody's Also Says Indonesia Economy Now Investment Grade". 18 January 2012. Archived from the original on 23 April 2012. Retrieved 20 May 2012.
- ^ "Indonesia Raised to Investment Grade by S&P on Budget Curbs". Bloomberg.com. 19 May 2017. Retrieved 28 January 2018.
- ^ Sulaiman, Stefanno; Suroyo, Gayatri (24 January 2023). "Indonesia's FDI jumps in 2022, led by mineral processing". reuters. Retrieved 14 May 2023.
- ^ "10 Negara Asal Investasi Asing Terbesar di Indonesia Tahun 2022". katadata (in Indonesian). Retrieved 14 May 2023.
- ^ "Indonesia Attracts Rp 328.9 Trillion Investment in Q1-2023". jakartaglobe. Retrieved 14 May 2023.
- ^ "Fortune Global 500 List 2022: See Who Made It". Fortune. Retrieved 13 January 2023.
- ^ "The Global 2000 2022". Forbes. Retrieved 13 January 2023.
- ^ Procee, Paul (5 May 2013). "Indonesia Economic Quarterly – January 2017" (PDF). World Bank. pp. 1–9. Archived from the original (PDF) on 4 February 2017. Retrieved 18 August 2017.
- ^ a b c "Spending for Development: Making the Most of Indonesia's New Opportunities Indonesia Public Expenditure Review 2007" (PDF). Archived from the original (PDF) on 9 August 2007. Retrieved 29 August 2011.
- ^ "The Politics of Free Public Services in Decentralized Indonesia" (PDF). Archived from the original (PDF) on 30 March 2012. Retrieved 3 March 2015.
- ^ Ihsanuddin (23 October 2018). Maharani, Dian (ed.). "Jokowi: Utang Indonesia Kecil Dibanding Negara Lain". KOMPAS.com (in Indonesian). Jakarta: Kompas Cyber Media. Retrieved 18 December 2018.
- ^ Alika, Rizky (23 October 2018). "Sri Mulyani Jelaskan Manfaat Kenaikan Utang Rp 1.329 T di Era Jokowi - Katadata News". katadata.co.id. Retrieved 18 December 2018.
- ^ Belinda (17 December 2018). "Utang Luar Negeri Indonesia Tetap Terkendali | Vibiznews". Retrieved 18 December 2018.
- ^ "Govt names 23 regions with best performance". Waspada.co.id. 25 April 2011. Retrieved 29 August 2011.
- ^ "The power nature and Indonesia's economy". The Jakarta Post. 6 June 2011. Archived from the original on 27 August 2011. Retrieved 29 August 2011.
- ^ "National Statistics, Republic of China (Taiwan)". stat.gov.tw. Retrieved 9 August 2016.
- ^ "Global wealth databook 2021" (PDF). Credit Suisse. June 2021. Archived (PDF) from the original on 23 June 2021.
- ^ "Close to 100,000 Super Rich Indonesians By 2015: Report". 2 September 2011. Archived from the original on 28 September 2012. Retrieved 2 September 2011.
- ^ Hilda B Alexander (19 March 2015). "18 Konglomerat Indonesia Tinggal di Jakarta".
- ^ Karmini, Niniek (6 December 2020). "Indonesia's social minister named suspect in million-dollar bribery case". The Sydney Morning Herald. Retrieved 6 December 2020.
- ^ Connors, Emma (25 November 2020). "Indonesian cabinet minister arrested in corruption probe". The Australian Financial Review. Retrieved 25 November 2020.
- ^ OECD (2016), Integrity Framework for Public Investment OECD Publishing
- ^ Most problematic factors for doing business in Indonesia, Archived 18 November 2017 at the Wayback Machine, World Economic Forum
- ^ "Parliament ratifies controversial revisions to law governing Indonesia's Corruption Eradication Commission | Coconuts Jakarta". 17 September 2019.
- ^ "Suharto with a saw: Indonesia is lurching back into authoritarianism with Joko Widodo at the helm", (October 2020) The Economist
- ^ Corruption, Not KPK, the Main Obstacle to Investment in Indonesia, Antigraft Agency Says, September 25, 2019 Jakarta Globe
- ^ "Grasberg Open Pit, Indonesia". Mining Technology. Retrieved 16 October 2017.
- ^ Schonhardt, Sara (26 December 2011). "As Indonesia Grows, Discontent Sets in Among Workers". The New York Times. Archived from the original on 3 January 2022. Retrieved 27 December 2011.
- ^ Fatima, Kaniz (9 September 2015). "Textile workers protest for new minimum wage in Indonesia". BanglaApparel.com. Archived from the original on 23 September 2015. Retrieved 9 September 2015.
- ^ Afifa, Laila (12 February 2020). "Omnibus Is Throwing People and Democracy under the Bus". Tempo. Retrieved 21 November 2020.
- ^ Bhwana, Petir Garda (17 November 2020). "Jokowi Asserts No Perpu to Revoke Job Creation Law". Tempo. Retrieved 21 November 2020.
- ^ Hakim, Rakhmat Nur (16 November 2020). Erdianto, Kristian (ed.). "Jokowi Sebut Protes terhadap UU Cipta Kerja Akan Ditampung di PP dan Perpres". KOMPAS.com (in Indonesian). Jakarta: Kompas Cyber Media. Retrieved 21 November 2020.
- ^ "Indonesia Poverty and wealth, Information about Poverty and wealth in Indonesia". Nationsencyclopedia.com. Retrieved 29 August 2011.
- ^ "120 poor regencies are in the east". The Jakarta Post. 18 July 2011. Retrieved 29 August 2011.
- ^ "Indonesia's Richest One% Controls Nearly Half of Nation's Wealth: Report". Retrieved 2 December 2016.
- ^ By the time of Sukarno's downfall in the mid-1960s, the economy was in chaos with 1,000% annual inflation, shrinking export revenues, crumbling infrastructure, factories operating at minimal capacity, and negligible investment. Schwarz (1994), pages 52–57
- ^ "Ir Soekarno The First President of Indonesia". Welcome2indonesia.com. 18 May 2010. Archived from the original on 18 July 2011. Retrieved 29 August 2011.
- ^ "Report for Selected Countries and Subjects". Imf.org. 14 September 2006. Retrieved 29 August 2011.
- ^ "Indonesia – Financial & Private Sector Development in Indonesia". World Bank. 18 October 2007. Retrieved 29 August 2011.
- ^ "Faced With Skyrocketing Food Prices, Indonesian Govt to Speed Up Work on Food Estate". Jakarta Globe. Archived from the original on 17 July 2011. Retrieved 29 August 2011.
- ^ "Indonesia Inflation Accelerates, Adding Pressure to Raise Rate :: Forex Trading Lebanon". Forextradinglb.com. 1 February 2011. Archived from the original on 11 July 2011. Retrieved 29 August 2011.
- ^ "Indonesia's Dec annual inflation rate at 3.61 pct, above forecast". NASDAQ.com. 1 January 2018. Retrieved 28 January 2018.
Further reading edit
- Eng, Pierre van der (2010). "The sources of long-term economic growth in Indonesia, 1880–2008" (PDF). Explorations in Economic History. 47 (3): 294–309. doi:10.1016/j.eeh.2009.08.004. hdl:1885/26726. S2CID 154260929. Archived (PDF) from the original on 29 April 2019.
External links edit
- Indonesia Economic Aftershock from the Dean Peter Krogh Foreign Affairs Digital Archives
- BKPM – Indonesia Investment Coordinating Board Archived 1 November 2020 at the Wayback Machine And Indonesia Investment News
- Indonesian Investment coorporation Archived 19 January 2023 at the Wayback Machine
- Comprehensive current and historical economic data
- World Bank Summary Trade Statistics Indonesia
- Indonesia Trading Instrument Quotex