


Summary
The economy of Poland is an industrialised, mixed economy with a developed market that serves as the sixth-largest in the European Union by nominal GDP and fifth-largest by GDP (PPP).[25] Poland boasts the extensive public services characteristic of most developed economies. Since 1988, Poland has pursued a policy of economic liberalisation but retained an advanced public welfare system. This includes universal free public healthcare and education (including tertiary), extensive provisions of free public childcare, and parental leave. The country is considered by many to be a successful post-communist state. It is classified as a high-income economy by the World Bank,[26] ranking 20th worldwide in terms of GDP (PPP), 21st in terms of GDP (nominal), and 21st in the 2023 Economic Complexity Index.[27]
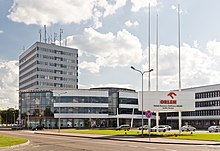
 Warsaw, central business district | |
| Currency | Złoty (PLN, zł) |
|---|---|
| Calendar year | |
Trade organisations | EU, WTO and OECD |
Country group |
|
| Statistics | |
| Population | |
| GDP | |
| GDP rank | |
GDP growth |
|
GDP per capita | |
GDP per capita rank | |
GDP by sector |
|
Population below poverty line | |
Labour force | |
Labour force by occupation |
|
| Unemployment | |
Average gross salary | 7,767 zł / €1,783 monthly |
| 5,625 zł / €1,291 monthly | |
Main industries |
|
| External | |
| Exports | |
Export goods |
|
Main export partners |
|
| Imports | |
Import goods |
|
Main import partners | |
FDI stock | |
Gross external debt | |
| Public finances | |
| Revenues | 41.3% of GDP (2019)[18] |
| Expenses | 42.0% of GDP (2019)[18] |
| Economic aid |
|
All values, unless otherwise stated, are in US dollars. | |
The largest component of Poland's economy is the service sector (62.3%), followed by industry (34.2%) and agriculture (3.5%). Following the economic reform of 1989, Poland's external debt has increased from $42.2 billion in 1989 to $365.2 billion in 2014. Poland shipped US$224.6 billion worth of goods around the globe in 2017, while exports increased to US$221.4 billion. The country's top export goods include machinery, electronic equipment, vehicles, furniture, and plastics. Poland was the only economy in the EU to avoid a recession through the 2007–08 economic downturn.[28]
As of 2019, the Polish economy had been growing steadily for 28 years, a record high in the EU. This record was only surpassed by Australia in the world economy.[29] GDP per capita at purchasing power parity has grown on average by 6% p.a. over the last 20 years, the highest in Central Europe. Poland's GDP has increased seven-fold since 1990.[30][31][32]
History edit
Poland has seen the largest increase in GDP per capita (more than 100%) both among the former Eastern Bloc countries, and compared to the EU-15 (around 45%).[33] It has had uninterrupted economic growth since 1992, even after the financial crisis of 2007–2008.[34]
Before 1989 edit
This article discusses the economy of post-1989 Poland. For a historical overview see:
- Economy of the People's Republic of Poland (1945–1989)
- Economy of the Second Polish Republic (1918–1939)
- Economy of the Polish–Lithuanian Commonwealth (1569–1795)
- Transportation and travel during the Polish–Lithuanian Commonwealth
1990–2009 edit
The Polish state steadfastly pursued a policy of economic liberalisation throughout the 1990s, with positive results for economic growth but negative results for some sectors of the population. The privatisation of small and medium state-owned companies and a liberal law on establishing new firms[35] has encouraged the development of the private business sector, which has been the main drive for Poland's economic growth. The agricultural sector remained handicapped by structural problems, surplus labour, inefficient small farms, and a lack of investment. Restructuring and privatisation of "sensitive sectors" (e.g. coal), has also been slow, but foreign investments in energy and steel have begun to turn the tide. Also, reforms in healthcare, education, the pension system, and state administration have resulted in larger than expected fiscal pressures. Improving this account deficit and tightening monetary policy, with a focus on inflation, are priorities for the Polish government. Further progress in public finance depends mainly on the reduction of public sector employment, and an overhaul of the tax code to incorporate farmers, who currently pay significantly lower taxes than other people with similar income levels.

Since the 2009 financial crisis edit
Since the global recession of 2009, Poland's GDP has continued to grow. In 2009, at the high point of the crisis, the GDP for the European Union as a whole dropped by 4.5% while Polish GDP increased by 1.6%. As of November 2013, the size of the EU's economy remains below the pre-crisis level, while Poland's economy increased by a cumulative 16%. The major reasons for its success appear to be a large internal market (in terms of population it is sixth in the EU) and a business-friendly political climate. The economic reforms implemented after the fall of communism in the 1990s have also played a role; between 1989 and 2007 Poland's economy grew by 177%, faster than other countries in Eastern and Central Europe, while at the same time millions were left without work.[34]
However, the economic fluctuations of the business cycle did affect Poland's unemployment rate, which by early 2013 reached almost 11%. This level was still below European average and has begun falling subsequently.[36] As of October 2017, Poland's unemployment rate stood at 4.6% according to Eurostat.[37]
Economic growth edit
In the period from 1989 to 2018, Poland's GDP increased by 826.96% and it was the best result in Europe. In the same period, Ireland's GDP grew by 789.43%, Slovakia's by 783.83% and the Czech Republic by 549.47%. In 1990, the Polish national income amounted to USD 65.978 billion, and by 2017 it had increased to USD 524.5 billion. Achieving these results was possible thanks to the privatisation of state-owned enterprises, the development of private entrepreneurship, but also the rapid increase in work efficiency and openness to foreign direct investments. In 2018, the Polish economy grew by 5.1% compared to 4.8% in 2017.[38] Economic growth in the fourth quarter of 2018 in Poland amounted to 4.9% on an annual basis and compared to the third quarter, where GDP increased by 5.1%, it was slightly lower. During this period, investments increased by 6.7%, private consumption also increased by 4.3%, and domestic demand increased by 4.8%.[39] The PMI index in January 2019 was 48.2 points and was higher than in December 2018 when it amounted to 47.6 points.[40]
Economic nationalism edit
Since 2015, under the Law and Justice (PiS) government, Poland has seen a growing wave of economic nationalism, with state-owned PZU in 2015 agreeing to buy a 25.3-percent stake in Alior Bank;[41][42] PZU, together with the Polish Development Fund, buying a 32.8% stake in Bank Pekao by UniCredit in 2017; state-owned PKN Orlen merging with its fellow state-run utility Energa in 2020; Lotos in 2022 and further plans to take over smaller rival PGNiG. The minister also suggested Poland should have greater control over the economy.[43][44][45]
Jarosław Kaczyński, leader of the Law and Justice party, said in 2022 that the Polish government might buy PKP Energetyka and Żabka convenience store from CVC Capital Partners.[46][47]
Data edit
The following table shows the main economic indicators in 1980–2021 (with IMF staff estimates in 2022–2027). Inflation under 5% is in green.[48]
| Year | GDP (in Bil. PLN) |
GDP (in Bil. US $PPP) |
GDP per capita (in US$ PPP) |
GDP (in Bil. US$ nominal) |
GDP per capita (in US$ nominal) |
GDP growth (real) |
Inflation rate (in percent) |
Unemployment (in percent) |
Government debt (in % of GDP) |
|---|---|---|---|---|---|---|---|---|---|
| 1980 | 0.3 | 171.6 | 4,823.8 | 56.7 | 1,595.0 | — | |||
| 1981 | — | ||||||||
| 1982 | — | ||||||||
| 1983 | — | ||||||||
| 1984 | — | ||||||||
| 1985 | — | ||||||||
| 1986 | — | ||||||||
| 1987 | — | ||||||||
| 1988 | — | ||||||||
| 1989 | — | ||||||||
| 1990 | 6.3% | — | |||||||
| 1991 | — | ||||||||
| 1992 | — | ||||||||
| 1993 | — | ||||||||
| 1994 | — | ||||||||
| 1995 | 48.7% | ||||||||
| 1996 | |||||||||
| 1997 | |||||||||
| 1998 | |||||||||
| 1999 | |||||||||
| 2000 | |||||||||
| 2001 | |||||||||
| 2002 | |||||||||
| 2003 | |||||||||
| 2004 | |||||||||
| 2005 | |||||||||
| 2006 | |||||||||
| 2007 | |||||||||
| 2008 | |||||||||
| 2009 | |||||||||
| 2010 | |||||||||
| 2011 | |||||||||
| 2012 | |||||||||
| 2013 | |||||||||
| 2014 | |||||||||
| 2015 | |||||||||
| 2016 | |||||||||
| 2017 | |||||||||
| 2018 | |||||||||
| 2019 | |||||||||
| 2020 | |||||||||
| 2021 | |||||||||
| 2022 | |||||||||
| 2023 | |||||||||
| 2024 | |||||||||
| 2025 | |||||||||
| 2026 | |||||||||
| 2027 |
Labour market and wages edit


Unemployment in Poland became a major problem after the fall of communism, although the economy previously had high levels of hidden unemployment[citation needed]. The unemployment rate then fell to 10% by the late 1990s and then increased again in the first few years of the 21st century, reaching a peak of 20% in 2002. It has since decreased, although unevenly. Since 2008 the unemployment rate in Poland has consistently been below European average.[49]
The rate fell below 8% in 2015 and[50] 3.2% in 2019[51] leading to a labour deficit.[52]
Foreign trade and FDI edit
With the collapse of the ruble-based COMECON trade bloc in 1991, Poland reoriented its trade. As early as 1996, 70% of its trade was with EU members. Neighbouring Germany is Poland's main trading partner today. Poland joined the European Union in May 2004. Before that, it fostered regional integration and trade through the Central European Free Trade Agreement (CEFTA), which included Hungary, the Czech Republic, Slovakia, and Slovenia.
Poland is a founding member of the World Trade Organization.[53] As a member of the European Union, it applies the common external tariff to goods from other countries including the United States. Poland's major imports are capital goods needed for industrial retooling and for manufacturing inputs. The country's exports also include machinery but are highly diversified. The most successful exports are furniture, foods,[54] motor boats, light planes, hardwood products, casual clothing, shoes, and cosmetics.[55] Germany is by far the biggest importer of Poland's exports as of 2013.[56] In the agricultural sector, the biggest money-makers abroad include smoked and fresh fish, fine chocolate, dairy products, meats, and specialty breads,[57] with the exchange rate conducive to export growth.[58] Food exports amounted to 62 billion złoty in 2011, increasing by 17% from 2010.[59] Most Polish exports to the U.S. receive tariff benefits under the Generalised System of Preferences (GSP) program. Poland ranks in the top 20 in the world both in terms of exports[60] and imports,[61] recording a clear trade surplus.
| Rank | Country | Total trade | Exports | Imports |
|---|---|---|---|---|
| 1 | 119,608 | 69,427 | 50,181 | |
| 2 | 36,021 | 2,979 | 33,042 | |
| 3 | 22,161 | 10,375 | 11,786 | |
| 4 | 21,373 | 13,452 | 7,921 | |
| 5 | 21,369 | 14,063 | 7,306 | |
| 6 | 19,355 | 10,236 | 9,119 | |
| 7 | 18,653 | 13,725 | 4,928 | |
| 8 | 17,372 | 7,157 | 10,216 | |
| 9 | 13,911 | 6,729 | 7,183 | |
| 10 | 11,177 | 6,084 | 5,093 | |
| 11 | 10,937 | 5,689 | 5,248 | |
| 12 | 10,731 | 7,029 | 3,702 | |
| 13 | 10,235 | 6,014 | 4,221 | |
| 14 | 9,792 | 6,094 | 3,698 | |
| 15 | 8,611 | 4,827 | 3,784 | |
| 16 | 7,853 | 5,259 | 2,593 | |
| 17 | 7,233 | 5,038 | 2,194 | |
| 18 | 6,805 | 4,048 | 2,757 | |
| 19 | 6,212 | 2,232 | 3,980 | |
| 20 | 6,134 | 649 | 5,485 | |
| — | Others | 83,713 | 38,775 | 44,938 |
| — | Total | 469,254 | 239,880 | 229,374 |
Poland is less dependent on external trade than most other Central and Eastern European countries, but its volume of trade with Europe is still substantial. In 2011 the volume of trade (exports plus imports) with the Eurozone as share of GDP was 40%, a doubling from the mid 1990s. 30% of Poland's exports are to Germany and another 30% to the rest of Europe. There has been substantial increase in Poland's exports to Russia.[64] However, in August 2014, exports of fruits and vegetables to Russia fell dramatically following its politically motivated ban by Moscow.[65]
Foreign direct investment (FDI) was at 40% of GDP in 2010, a doubling over the level in 2000. Most FDI into Poland comes from France, Germany, and the Netherlands. Polish firms in turn have foreign investments primarily in Italy and Luxembourg. Most of the internal FDI is in manufacturing, which makes it susceptible to economic fluctuations in the source countries.[64]
The UAE is Poland's largest trading partner in the Arab world.[66]
The government offers investors various forms of state aid, such as CIT tax at the level of 19% and investment incentives in 14 Special Economic Zones (among others: income tax exemption, real estate tax exemption, competitive land prices), several industrial and technology parks, the possibility to benefit from the EU structural funds, brownfield and greenfield locations. According to the National Bank of Poland (NBP), the level of FDI inflow into Poland in 2006 amounted to €13.9 billion.
According to an Ernst & Young report, Poland ranks 7th in the world in terms of investment attractiveness. However, Ernst & Young's 2010 European attractiveness survey reported that Poland saw a 52% decrease in FDI job creation and a 42% decrease in number of FDI projects since 2008.[67] According to an OECD report, in 2004 Poland was one of the hardest-working nations in Europe. In 2010, the World Economic Forum ranked Poland near the bottom of OECD countries in terms of the clarity, efficiency, and neutrality of the legal framework used by firms to settle disputes.[68]
Sectors edit
In 2022, the sector with the highest number of companies registered in Poland is services with 273,851 companies followed by finance, insurance, and real estate and retail trade with 113,153 and 87,237 companies respectively.[69]
Production industries edit


Before World War II, Poland's industrial base was concentrated in the coal, textile, chemical, machinery, iron, and steel sectors. Today it extends to fertilizers, petrochemicals, machine tools, electrical machinery, electronics, car manufacturing, and shipbuilding.
Poland's industrial base suffered greatly during World War II, and many resources were directed toward reconstruction. The socialist economic system imposed in the late 1940s created large and unwieldy economic structures[70] operated under a tight central command. In part because of this systemic rigidity, the economy performed poorly even in comparison with other economies in Central Europe.[70]
In 1990, the Tadeusz Mazowiecki government began a comprehensive reform programme to replace the centralised command economy with a market-oriented system. While the results overall have been impressive, many large state-owned industrial enterprises, particularly the rail, mining, steel, and defence sectors, have remained resistant to change and the downsizing required to survive in a market-based economy.[70]
Energy edit
Pharmaceuticals edit
The total value of the Polish pharmacy market in 2008 was PLN 24.1bn, 11.5% more than in 2007.[71]
The non-prescription medicines market, which accounts for about one-third of the total market value, was worth PLN 7.5bn in 2008. This value includes drugs and non-drugs such as dietary supplements, cosmetics, dressings, dental materials, diagnostic tests, and medical devices. The prescription medicines market was worth PLN 15.8bn.[72]
Mining edit
In 2019, the country was the 3rd largest world producer of rhenium;[73] 5th largest producer of silver in the world;[74] the 12th largest producer of copper;[75] the world's 14th largest producer of sulfur;[76] in addition to being the world's 14th largest producer of salt.[77]
Agriculture edit
Agriculture employs 8.2% of the workforce but contributes 3.8% to GDP, reflecting relatively low productivity. Unlike the industrial sector, Poland's agricultural sector remained largely in private hands during the decades of real socialist rule. Most of the former state farms are now leased to farmer tenants. Lack of credit is hampering efforts to sell former state farmland. Currently, Poland's 2 million private farms occupy 90% of all farmland and account for roughly the same percentage of total agricultural production. Farms are small—8 hectares on average—and often fragmented. Farms with an area exceeding 15 ha accounted for 9% of the total number of farms but cover 45% of total agricultural area. Over half of all farm households in Poland produce only for their own needs with little, if any, commercial sales.
Poland is a net exporter of processed fruit and vegetables, meat, and dairy products. Processors often rely on imports to supplement domestic supplies of wheat, feed grains, vegetable oil, and protein meals, which are generally insufficient to meet domestic demand. However, Poland is the leading EU producer of potatoes and rye and is one of the world's largest producers of sugar beets and triticale. Poland is also a significant producer of rapeseed, grains, hogs, and cattle. Poland is the sixth-largest producer and exporter of apples in the entire world.[78]
Tourism edit
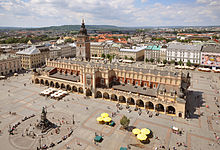
Poland, especially after joining the EU in 2004, became a place frequently visited by tourists. Most tourist attractions in Poland are connected with natural environment, historic sites, and cultural events. They draw millions of tourists every year from all around the world. According to Tourist Institute's data, Poland was visited by 15.7 million tourists in 2006, and by 15 million tourists in 2007,[79] out of the total number of 66.2 million foreign visitors.[80] In 2016 the number of arrivals to Poland amounted to 80.5 million. 17.5 million of this number are arrivals considered for tourism purposes (with at least one night's stay), making it the 16th most visited country in the world.[81] The most popular cities are Kraków, Warsaw, Gdańsk, Wrocław, Łódź, Poznań, Szczecin, Lublin, Toruń, Sopot, Zakopane, and the Wieliczka Salt Mine. The best recreational destinations include Poland's Masurian Lake District, Baltic Sea coast, Tatra Mountains (the highest mountain range of the Carpathians), Sudetes, and Białowieża Forest. Poland's main tourist offers consist of sightseeing within cities and out-of-town historical monuments, business trips, qualified tourism, agrotourism, mountain hiking (trekking), and climbing among others.
Financial sector edit
The Polish banking sector is regulated by the Polish Financial Supervision Authority (PFSA).
While transforming the country to a market-oriented economy during 1992–97, the government privatised some banks, recapitalised the rest, and introduced legal reforms that made the sector competitive. These reforms, and the health and relative stability of the sector, attracted a number of strategic foreign investors. At the beginning of 2009, Poland's banking sector had 51 domestic banks, a network of 578 cooperative banks and 18 branches of foreign-owned banks. In addition, foreign investors had controlling stakes in nearly 40 commercial banks, which made up 68% of the banking capital.[82] Banks in Poland reacted to the financial crisis of 2009 by restraining lending, raising interest rates, and strengthening balance sheets. Subsequently, the sector started lending again, with an increase of more than 4% expected in 2011.
Venture capital edit
The segment of the private equity market that finances early-stage high-risk companies, with the potential for fast growth, had 130 active firms in Poland (as of March 2019). Between 2009 and 2019, these entities have invested locally in over 750 companies, an average of 9 companies per portfolio. Since 2016, new legal institutions have been established for entities investing in enterprises in the seed or startup phase. In 2018, venture capital funds invested €178 million in Polish startups (0.033% of GDP). As of March 2019, total assets managed by VC companies operating in Poland are estimated at €2.6 billion. The total value of investments of the Polish VC market is €209.2 million.[83]
Transportation edit

Poland is served by an extensive network of railways. In most cities, the main railway station is located near a city centre and is well connected to the local transportation system. The infrastructure is operated by Polish State Railways, part of state-run PKP Group. The rail network is very dense in western and northern Poland, while the eastern part of the country is less developed. The capital city, Warsaw, has the country's only rapid transit system: the Warsaw Metro.
Poland's busiest airport is Warsaw Chopin Airport. Warsaw Chopin serves as the main international hub for Poland's flag carrier LOT Polish Airlines. In addition to Warsaw Chopin, Wrocław, Gdańsk, Katowice, Kraków, and Poznań all have international airports. In preparation for the Euro 2012 football championships jointly hosted by Poland and Ukraine, a number of airports around the country were renovated and redeveloped. This included the building of new terminals with an increased number of jetways and stands at both Wrocław Airport in Wrocław and Lech Wałęsa Airport in Gdańsk.
Poland has 412,264 km (256,170 mi) of public roads. Polish public roads are categorised by administrative division, which include national roads, voivodeship roads, Powiat roads, and Gmina roads. Motorways and expressways are part of the national road network. As of January 2020, there are 4,000 km of motorways and expressways in use.[84]
Major companies in Poland edit
Selection of major Polish companies including from the list of 500 largest companies in Poland compiled by magazine Polityka:[85]
- PKO Bank Polski – banking
- InPost – package delivery logistics
- Orlen – petrochemicals
- Bank Pekao – banking
- PZU – insurance
- Grupa Azoty – chemical manufacturing[85]
- Dino – grocery supermarkets
- Izera – electric vehicle manufacturer
- Galeon Yachts – yacht manufacturer
- Sunreef Yachts – yacht manufacturer
- Autosan – bus manufacturer
- Solaris Bus & Coach – bus and tram manufacturing
- Newag – train and tram manufacturing
- PESA – train and tram manufacturing
- QLOC – software developer/video game port developer
- Allegro – retail and online auctions
- Techland – video games
- E. Wedel – chocolate goods
- People Can Fly – video games
- 4F – sports equipment
- LPP – clothing
- Vistula Group (pl) – clothing
- CD Projekt – video game distribution and development
- Ursus – agricultural tractors
- Platige Image – computer graphics and special effects
- Pronar – agricultural machinery
- Netguru – IT
- Orange Polska – telecommunications
- Netia – telecommunications
- Black Red White – furniture
- PSE-Operator – national power grid operator
- PGNiG – oil and gas
- Polsat – media
- Agora SA – media
- Nowy Styl Group – office furniture manufacturer
- Maspex – food manufacturing
- ROMET – bicycles
- Delphia Yachts – yacht manufacturer
- Inglot Cosmetics – beauty, cosmetics
- Dr. Irena Eris – beauty, cosmetics
- WB Group – defence industry
- Apart – jewelry
- Beesfund – crowdfunding company
- Grycan – ice cream company
- Orbis – hotels
- Asseco – IT
- KGHM Polska Miedź – copper mining
- Kompania Węglowa – coal mining
- Echo Investment – real estate development
- Pekaes – logistics
- Polferries – transport
- Grupa Lotos – petrochemicals
- FB "Łucznik" Radom – defence industry
- Polish State Railways (PKP) – national railway
- Poczta Polska – national post
- Cersanit – ceramic goods (sanitary and tiles)
- TVN – media
- Globe Trade Centre – real estate development
- Elektrim – diversified utilities, mobile phone service
- Arrinera – automotive
- Ericpol – IT
- Volkswagen Poznań – automotive
- Fiat – Polish branch of Fiat Group (former FSM)
- General Motors Poland – automotive
- Warsaw Stock Exchange
- Comarch – IT
- LiveChat Software – IT
- RTB House – online advertising
- Tauron Group – electricity distribution
- Boryszew – automotive industry
- ZMT SA – defence industry
- Amica – engineering industry
- CIECH – chemical industry
- Polar – home appliances
- PMR Ltd – B2B market research, business consultancy
- Metro Group Poland – retail
- Wielton – utility vehicles manufacturer
- Zortrax – 3D printing
- CI Games – video games
- Metal Master – private jet aircraft
- Kross SA – bicycles
Currency edit
Budget and debt edit

The public and private debt levels of Poland are below the European average (2017).
GDP growth in Poland edit
Recent GDP growth (comparing to the same quarter of previous year):[86]
| Year | Q1 | Q2 | Q3 | Q4 | Overall |
|---|---|---|---|---|---|
| 2023 | -0.3% | -0.06% | 0.4% | 1.4% | 0.2% |
| 2022 | 8.5% | 5.5% | 3.5% | 2.5% | 4.9% |
| 2021 | -0.9% | 11.1% | 5.8% | 7.3% | 5.9% |
| 2020 | 2.0% | -8.3% | -1.7% | -2.7% | -2.2% |
| 2019 | 5.5% | 5.4% | 4.6% | 3.7% | 4.8% |
| 2018 | 5.2% | 5.3% | 5.2% | 4.9% | 5.2% |
| 2017 | 4.6% | 4.3% | 5.5% | 5.1% | 4.9% |
| 2016 | 3.1% | 3.4% | 2.8% | 2.8% | 3.0% |
| 2015 | 3.8% | 3.3% | 3.6% | 4.6% | 3.8% |
| 2014 | 3.1% | 3.3% | 3.4% | 3.3% | 3.3% |
| 2013 | 0.1% | 0.6% | 1.9% | 2.7% | 1.3% |
| 2012 | 3.3% | 2.3% | 1.0% | 0.2% | 1.7% |
| 2011 | 4.9% | 4.8% | 5.0% | 5.3% | 5.0% |
| 2010 | 2.1% | 3.6% | 4.0% | 4.8% | 3.6% |
| 2009 | 1.5% | 1.9% | 2.7% | 4.2% | 2.6% |
| 2008 | 5.5% | 4.9% | 3.7% | 1.9% | 4.0% |
| 2007 | 7.7% | 7.3% | 6.9% | 6.9% | 7.2% |
| 2006 | 5.6% | 6.3% | 6.5% | 6.3% | 6.2% |
| 2005 | 2.2% | 2.8% | 4.3% | 4.8% | 3.5% |
| 2004 | 7.0% | 5.7% | 4.6% | 3.6% | 5.2% |
| 2003 | 1.8% | 3.6% | 4.0% | 4.6% | 3.5% |
| 2002 | 0.6% | 0.9% | 1.9% | 2.2% | 1.4% |
| 2001 | 2.4% | 1.2% | 1.0% | 0.5% | 1.3% |
| 2000 | 6.1% | 5.4% | 3.3% | 2.7% | 4.4% |
| 1999 | 2.2% | 3.5% | 5.4% | 6.6% | 4.4% |
| 1998 | 6.6% | 5.4% | 5.0% | 3.2% | 5.1% |
| 1997 | 7.1% | 7.7% | 7.0% | 6.6% | 7.1% |
| 1996 | 3.5% | 5.7% | 7.4% | 8.1% | 6.2% |
Location edit
Poland has an excellent location for transporting locally made components or products to the rest of Europe. For example, when moving production from China, the new factory in Poland can move their goods in 24 hours to the most populated parts of Europe, and in 48 hours to all of Europe.[87]
Potential of the Polish economy in the EU edit
Poland, measured by the purchasing power parity index, is the sixth-largest economy in the European Union and the eighth-largest economy in Europe, slightly ahead of the Netherlands.
Poland recorded GDP growth even during the 2008–09 financial crisis.[88] The unemployment rate in the country remains very low and amounted to 5% in September 2023.[89]
Although the Polish economy is catching up with the countries of Western Europe, this process is progressing slowly. So far, taking into account the level of social development, Poland has managed to overtake Portugal. There is a great deal of variation between regions. Masovian Voivodeship is on a similar level to the richest regions of Spain and most regions of France (82% of the EU average). However, it should be remembered that the GDP of this voivodeship is mainly generated by Warsaw. Lower Silesian Voivodeship with a GDP of $16,000 is on par with Portugal and the regions of Spain and Greece. Subsequent voivodeships reached about 50% of the EU average, and the poorest voivodships of the eastern wall have GDP per capita comparable to Romania and Bulgaria.
Polish capital has several large concerns in this region of Europe, i.e. PKN Orlen, which has its stations in Germany and Lithuania, Polsat, which also invests in Lithuania, the ITI Group. Poland has a highly developed road network, most of the A1, A2, A4 highways and expressways, including S6 and S7, are fully completed. The next ones are to be ready by 2023. Their construction by private companies is financed in part by the EU. In the coming years, Poland is to receive approximately EUR 4.5 billion for the modernisation of railways.
Poland is one of the key immigration destinations in the EU, having attracted more non-EU immigrants, already in 2021 mostly from Ukraine, than any other EU country for a few consecutive years.[90]
International rankings edit

| Very high (≥ 0.800) High (0.700–0.799) Medium (0.550–0.699) | Low (≤ 0.549) Data unavailable |
- 36th in Human Development Index (2022)
- 37th in Inequality-adjusted Human Development Index (2022)
- 25th in Average Wage Index (2022)
- 41st in Democracy Index (2023)
- 6th in Henley Passport Index (2024)[91]
- 4th in The Passport Index (2024)[92]
- 27th in OECD Better Life Index (2020)
- 23rd in Human Capital Index (2020)
- 20th in Quality of Nationality Index (2018)
- 37th in Legatum Prosperity Index (2023)
- 39th in Social Progress Index (2022)
- 13th in EF English Proficiency Index (2023)
- 40th in Ease of Doing Business (2020)
- 21st in Economic Complexity Index (2023)
- 37th in Global Competitiveness Report (2019)
- 40th in Index of Economic Freedom (2023)
- 29th in Global Peace Index (2023)
- 47th in Corruption Perceptions Index (2023)
- 38th in Global Innovation Index (2023)
- 27th in Good Country Index (2022)
- 56th in Press Freedom Index (2023)
See also edit
- Corruption in Poland
- Economy of the European Union
- Education in Poland
- List of Polish voivodeships by GDP per capita
- List of Polish voivodeships by Human Development Index
- National Bank of Poland
- Poland A and B
- Poverty in Poland
- Science and technology in Poland
- Taxation in Poland
- Tourism in Poland
- Trade unions in Poland
- Video games in Poland
- Warsaw Stock Exchange
References edit
- ^ "World Economic and Financial Surveys World Economic Outlook Database—WEO Groups and Aggregates Information April 2020". IMF.org. International Monetary Fund. Archived from the original on 22 December 2019. Retrieved 9 September 2020.
- ^ "World Bank Country and Lending Groups". datahelpdesk.worldbank.org. World Bank. Archived from the original on 28 October 2019. Retrieved 29 September 2019.
- ^ a b c d e f g h i "Poland". CIA.gov. Central Intelligence Agency. Retrieved 4 February 2023.
- ^ "Population on 31 March 2021". GUS. Archived from the original on 19 October 2019. Retrieved 16 April 2022.
- ^ a b c d e f "World Economic Outlook Database, April 2024". IMF.org. International Monetary Fund. Retrieved 25 April 2024.
- ^ "Poverty headcount ratio at national poverty lines (% of population)". data.worldbank.org. World Bank. Retrieved 20 December 2023.
- ^ "Persons at risk of poverty or social exclusion". ec.europa.eu. Eurostat. Retrieved 20 December 2023.
- ^ "Gini coefficient of equivalised disposable income - EU-SILC survey". ec.europa.eu. Eurostat. Retrieved 20 December 2023.
- ^ Nations, United. "Human Development Report 2023-24". hdr.undp.org. UNDP. Retrieved 25 April 2024.
- ^ Nations, United. "Inequality-adjusted HDI (IHDI)". hdr.undp.org. UNDP. Retrieved 25 April 2024.
- ^ "Labor force, total - Poland". data.worldbank.org. World Bank. Retrieved 20 December 2023.
- ^ "Employment rate by sex, age group 20-64". ec.europa.eu/eurostat. Eurostat. Archived from the original on 13 August 2019. Retrieved 30 May 2019.
- ^ "Pracujący w rolnictwie, przemyśle i usługach | RynekPracy.org".
- ^ "Unemployment by sex and age - monthly average". appsso.eurostat.ec.europa.eu. Eurostat. Archived from the original on 9 August 2019. Retrieved 16 July 2022.
- ^ "Unemployment rate by age group". data.oecd.org. OECD. Retrieved 20 October 2020.
- ^ "Poland - Country Commercial Guide". trade.gov. Retrieved 19 March 2023.
- ^ "Poland - Country Commercial Guide". trade.gov. Retrieved 19 March 2023.
- ^ a b c d e f "Euro area and EU27 government deficit both at 0.6% of GDP" (PDF). ec.europa.eu/eurostat. Eurostat. Retrieved 28 April 2020.
- ^ "European Cohesion Policy in Poland" (PDF). Archived from the original (PDF) on 25 December 2017. Retrieved 25 December 2017.
- ^ "European structural and investment funds" (PDF). Archived (PDF) from the original on 20 April 2017. Retrieved 25 December 2017.
- ^ "S&P keeps Poland's rating, outlook unchanged". thenews.pl. Archived from the original on 26 December 2017. Retrieved 25 March 2018.
- ^ "Moody's changes outlook on Poland's A2 issuer rating to stable from negative; affirms ratings". moodys.com. 12 May 2017. Archived from the original on 24 September 2017. Retrieved 25 March 2018.
- ^ "Press Release". www.fitchratings.com. Archived from the original on 23 December 2017. Retrieved 25 March 2018.
- ^ Scope Ratings (2 June 2023). "Scope downgrades the Republic of Poland's credit ratings to A; Outlook revised to Stable". Scope Ratings. Retrieved 3 June 2023.
- ^ "Report for Selected Countries and Subjects". www.imf.org. Archived from the original on 8 July 2018. Retrieved 25 March 2018.
- ^ "WDI 2017 Maps - Data". data.worldbank.org. Archived from the original on 23 June 2018. Retrieved 25 March 2018.
- ^ "Complexity rankingsThe Atlas of Economic Complexity". Harvard' Growth Lab Viz Hub. Retrieved 31 October 2020.
- ^ "Poland was a". reuters.com. 21 April 2016. Archived from the original on 23 June 2018. Retrieved 25 March 2018.
- ^ Shotter, James; Majos, Agata (9 October 2019). "Poland election: the unfinished counter-revolution". Financial Times. Archived from the original on 3 December 2019. Retrieved 9 October 2019.
- ^ "'This is the golden age': eastern Europe's extraordinary 30-year revival". theguardian.com. 27 October 2019. Archived from the original on 10 December 2019. Retrieved 27 October 2019.
- ^ Frączyk, Jacek (7 December 2017). "Wzrostem PKB Polska zostawia Europę daleko z tyłu. Najnowsze dane Eurostatu". money.pl. Archived from the original on 23 June 2018. Retrieved 25 March 2018.
- ^ "FTSE Russell upgrades Poland from emerging to developed market". thenews.pl. Archived from the original on 30 November 2018. Retrieved 25 March 2018.
- ^ Piatkowski, Marcin (30 November 2001). "How Poland Became Europe's Growth Champion: Insights from the Successful Post-Socialist Transition". brookings.edu. Archived from the original on 1 July 2018. Retrieved 25 March 2018.
- ^ a b "The Next Economic Powerhouse? Poland - BusinessDay : News you can trust". businessdayonline.com. 5 July 2017. Archived from the original on 2 May 2019. Retrieved 25 March 2018.
- ^ Cieński, Jan (2018). Start-Up Poland. Chicago: The University of Chicago Press. p. 17. ISBN 978-0-226-30681-0.
- ^ "Poland has employee's market: minister". thenews.pl. Archived from the original on 1 July 2018. Retrieved 25 March 2018.
- ^ "File:Unemployment rates, seasonally adjusted, October 2017 (%) F2.png - Statistics Explained". ec.europa.eu. Archived from the original on 8 July 2018. Retrieved 25 March 2018.
- ^ "Polska tygrysem gospodarczym Europy. Wzrost PKB o 827 proc". wnp.pl. Retrieved 9 April 2021.
- ^ "GUS: wzrost PKB pod koniec roku był nieco słabszy niż kwartał wcześniej". wnp.pl. Retrieved 9 April 2021.
- ^ "Wskaźnik PMI dla Polski w styczniu na poziomie 48,2 pkt. vs 47,6 pkt. w XII". wnp.pl. Retrieved 9 April 2021.
- ^ "Poland's Top Insurer Buys a Stake in Alior Bank, with More of the Same to Follow". 5 June 2015.
- ^ Rohac, Dalibor (30 June 2017). "Poland's rush to banking sector socialism". Financial Times. Archived from the original on 10 December 2022.
- ^ "Poland should aim to merge state-run companies - minister". Reuters. 27 April 2020.
- ^ Barteczko, Agnieszka; Yun Chee, Foo (30 March 2020). "PKN ready to offer concessions after EU warning on Lotos bid - sources". Reuters.
- ^ "Poland's government wants to take control of banking". The Economist. 9 August 2018.
- ^ "Poland close to buying PKP Energetyka from CVC Capital Partners -ruling party leader". Reuters. 12 October 2022.
- ^ "Poland Eyes Grocery Chain as It Takes Back Control of Economy". Bloomberg.com. 13 October 2022. Retrieved 18 January 2023.
- ^ "Report for Selected Countries and Subjects".
- ^ "File:Unemployment rates, seasonally adjusted, October 2015.png - Statistics Explained". ec.europa.eu. Archived from the original on 27 December 2017. Retrieved 25 March 2018.
- ^ "Unemployment statistics - Statistics Explained". ec.europa.eu. Archived from the original on 14 March 2016. Retrieved 25 March 2018.
- ^ "Unemployment in Bulgaria in November 2019 was 3.7% – Eurostat". The Sofia Globe staff o. Archived from the original on 13 January 2020. Retrieved 13 January 2020.
- ^ Internet, JSK. "Poland facing risk of labor force deficit in 2015". msp.gov.pl. Archived from the original on 9 April 2018. Retrieved 25 March 2018.
- ^ "Poland: June 2000". Trade Policy Reviews. World Trade Organization. 26 June 2000. Archived from the original on 1 July 2018. Retrieved 21 May 2014.
- ^ PAP, 9 May 2013 Polska żywność - fundament polskiego eksportu - 2012 kolejnym rokiem rekordowego eksportu żywności. Ministerstwo Skarbu Państwa (Internet Archive).
- ^ GUS, Najwięksi partnerzy handlowi Polski: kto kupuje nasze produkty? 9 July 2014 (Internet Archive)
- ^ Ministerstwo Gospodarki, Polska - kierunki eksportu i najchętniej kupowane produkty z naszego kraju. 8 December 2013 Euro-Dane :: Ekonomia Unii Europejskiej (Internet Archive). Most important importers of Poland's 2012 exports, graph. Archived 6 November 2014 at the Wayback Machine Manifo.
- ^ Patrycja Maciejewicz, Leszek Baj, Polska żywność jedzie w świat. Pełno niespodzianek 2012-04-07, Wyborcza.biz (Internet Archive).
- ^ PAP, Więcej niż 80 proc. eksportu żywności z Polski to przetworzone produkty spożywcze 10-10-2014 Portal Spozywczy.pl (Internet Archive).
- ^ Wiesław Łopaciuk, Padł rekord wartości eksportu produktów rolno-spożywczych z Polski. Powód: słaby złoty Rzeczpospolita, 27-01-2012 (Internet Archive). "Z analizy "Rzeczpospolitej" wynika, że łączna wartość eksportu produktów rolno-spożywczych Polski mogła w 2011 r. sięgnąć 62 mld zł. W porównaniu z 2010 r. była o niemal 17 proc. wyższa."
- ^ Workman, Daniel. "World's Top Export Countries". Retrieved 3 December 2020.
- ^ "Leading import countries worldwide in 2019". Retrieved 3 December 2020.
- ^ "Syntetyczna informacja O eksporcie I imporcie Polski styczeń - grudzień 2020 rok w mln EUR". Ministerstwo Rozwoju i Technologii.
- ^ "Analizy z obszaru handlu zagranicznego - Ministerstwo Rozwoju i Technologii - Portal Gov.pl".
- ^ a b Ho, Giang (July 2012). "Republic of Poland. Selected Issues" (PDF). IMF Country Report. 12 (163). Archived (PDF) from the original on 21 May 2014. Retrieved 21 May 2014.
- ^ "Ban on food imports due to health concerns, not politics: Russia - Channel NewsAsia". Archived from the original on 22 October 2014. Retrieved 5 August 2014.
- ^ UAEinteract.com. "UAE is Poland's largest Arab trading partner". Uaeinteract.com. Archived from the original on 17 September 2011. Retrieved 25 May 2011.
- ^ Schwab, Klaus. "The Global Competitiveness Report 2010-2011" (PDF). World Economic Forum. Archived (PDF) from the original on 6 December 2010. Retrieved 25 April 2011.
- ^ "Waking up to the new economy: Ernst & Young's 2010 European attractiveness survey" (PDF). Ernst & Young. Archived from the original (PDF) on 4 July 2010. Retrieved 25 April 2011.
- ^ "Industry Breakdown of Companies in Poland". HitHorizons.
- ^ a b c "Poland (11/07)". US Department of State. Archived from the original on 25 December 2019. Retrieved 25 September 2013.
- ^ KPMG. "The Polish Pharmaceutical Market" (PDF). Yieldopedia. Archived from the original (PDF) on 12 June 2018. Retrieved 7 June 2018.
- ^ "Polish pharmaceutical market". Pharmapoland.com. Archived from the original on 3 September 2011. Retrieved 25 May 2011.
- ^ "USGS Rhenium Production Statistics" (PDF).
- ^ "USGS Silver Production Statistics" (PDF).
- ^ "USGS Copper Production Statistics" (PDF).
- ^ "USGS Sulfur Production Statistics" (PDF).
- ^ "USGS Salt Production Statistics" (PDF).
- ^ Top 10 apple-producing countries in the world. Archived 9 March 2016 at the Wayback Machine WhichCountry.co, General Knowledge.
- ^ Information about tourism in Poland (in Polish). Archived 16 April 2013 at archive.today Source: Instytut Turystyki, 2008.
- ^ GUS (2008). "Przyjazdy do Polski (Foreign visits to Poland)". Statistics (in Polish). Instytut Turystyki. Archived from the original on 25 December 2012. Retrieved 31 December 2012.
- ^ "International tourism, number of arrivals - Country Ranking". Archived from the original on 6 November 2017. Retrieved 28 October 2017.
- ^ Wprost (9 November 2011). "Belka: polskie banki znów powinny być polskie". 70 proc. polskiego systemu bankowego jest własnościowo zdominowane przez banki zagraniczne. Biznes: Polityka i gospodarka, Wprost.pl. Archived from the original (Internet Archive) on 12 November 2014. Retrieved 12 November 2014.
w Polsce nie zbudowano by nowoczesnego systemu bankowego [bez akcjonariuszy zagranicznych, stwierdził Prezes NBP. Bez nich] Polska nie uniknęłaby kryzysu bankowego – Marek Belka, prezes Narodowego Banku Polskiego.
- ^ Krysztofiak-Szopa, Julia; Wisłowska, Monika (2019). The Golden Book of Venture Capital in Poland 2019. Warsaw: Startup Poland. ISBN 978-83-948788-6-3. Archived from the original on 23 January 2020. Retrieved 13 June 2019.
- ^ Boner, Błażej. "Od dziś w Polsce jest 4 tys. km dróg szybkiego ruchu. To dokładnie połowa tego, co zaplanowano". Archived from the original on 9 November 2019. Retrieved 13 January 2020.
- ^ a b "500 largest companies in Poland". Lista500.polityka.pl. Polityka. Archived from the original on 24 May 2011. Retrieved 25 May 2011.
- ^ "Quarterly National Accounts : Quarterly Growth Rates of real GDP, change over previous quarter". Stats.oecd.org. Archived from the original on 18 November 2021. Retrieved 4 December 2021.
- ^ "Chińczycy chcą wybudować fabryki w Polsce!".
- ^ Rogaliński, Paweł (2011). Świat, Polityka i my. Łódź. pp. 101–102. ISBN 978-83-272-3154-3.
- ^ "Unemployment rate 1990-2023". stat.gov.pl. Retrieved 28 October 2023.
- ^ "'Poland issues EU's most residence permits to immigrants for fourth year running". 12 October 2021. Retrieved 9 February 2022.
- ^ "Global Passport Ranking". Retrieved 8 January 2024.
- ^ "Global Passport Power Rank 2024". Retrieved 7 January 2024.
- Worldmark Encyclopedia of National Economics, Volume 4 – Europe, Gale Group, 2002, ISBN 0-7876-4955-4
- Economic data from Eastern European Markets (ceeMarket.com)
External links edit
- www.paiz.gov.pl Archived 5 September 2019 at the Wayback Machine
- Attractiveness Europe 2007
- The Polish economy in 2007 on YouTube
- Articles on Polish economy in Central and Eastern European Packaging magazine Archived 23 June 2018 at the Wayback Machine
- OECD's Poland country Web site and OECD Economic Survey of Poland
- Business Portal for Poland Archived 8 March 2018 at the Wayback Machine
- World Bank Summary Trade Statistics Poland
- Tariffs applied by Poland as provided by ITC's ITC Market Access Map[permanent dead link], an online database of customs tariffs and market requirements