


Summary
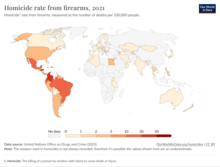
This is a historical list of countries by firearm-related death rate per 100,000 population in the listed year.
Homicide figures may include justifiable homicides along with criminal homicides, depending upon jurisdiction and reporting standards. Not included are homicides, suicides, accidental deaths, or justifiable deaths by any means other than by firearm.
Based upon various metrics alongside calculations over the course of multiple years, Singapore has the lowest firearm-related death rate in the world, and El Salvador used to have the highest, until very recently.[2][3]
Table of homicide rates from firearms edit
All the data in this table is from United Nations Office on Drugs and Crime – processed by Our World in Data.[1]
| Location | 2015 | 2016 | 2017 | 2018 | 2019 | 2020 | 2021 |
|---|---|---|---|---|---|---|---|
| 1.60 | 1.49 | 1.53 | 1.60 | 1.64 | 1.43 | 1.75 | |
| 0.22 | 0.14 | 0.13 | 0.09 | 0.08 | 0.13 | 0.14 | |
| 0.00 | |||||||
| 1.11 | 4.42 | 10.97 | 3.27 | 2.17 | 3.24 | 4.29 | |
| 3.65 | 2.83 | 2.73 | 2.52 | 2.68 | 2.42 | ||
| 0.90 | 0.52 | 0.63 | 0.21 | 0.67 | |||
| 0.11 | 0.13 | 0.09 | 0.10 | 0.15 | 0.08 | 0.10 | |
| 0.06 | 0.10 | 0.18 | 0.09 | 0.10 | 0.13 | 0.18 | |
| 0.18 | 0.18 | 0.15 | 0.19 | 0.18 | 0.16 | ||
| 28.52 | 23.74 | 26.82 | 20.15 | 19.53 | 14.27 | 25.50 | |
| 6.83 | 5.74 | 8.24 | 6.44 | 11.06 | 9.26 | 6.05 | |
| 19.73 | 22.32 | 21.88 | 25.13 | 23.39 | 20.00 | 22.75 | |
| 1.58 | 7.93 | 4.74 | 4.72 | 0.00 | 3.12 | 4.67 | |
| 0.00 | 0.00 | 0.00 | 0.00 | 0.00 | 0.00 | ||
| 0.10 | 0.17 | 0.38 | 0.27 | 0.27 | 0.18 | 0.31 | |
| 0.91 | 0.55 | 0.67 | 0.44 | 0.62 | 0.36 | 0.43 | |
| 15.94 | |||||||
| 0.29 | 0.15 | 0.24 | |||||
| 0.50 | 0.62 | 0.73 | 0.68 | 0.70 | 0.73 | 0.78 | |
| 2.72 | 5.55 | 2.12 | 1.93 | ||||
| 1.47 | 1.53 | 1.82 | 2.02 | 1.75 | 2.38 | 1.86 | |
| 19.68 | 18.53 | 18.36 | 19.09 | 18.87 | 18.42 | 20.81 | |
| 7.86 | 7.77 | 8.71 | 7.96 | 7.47 | 7.91 | 8.30 | |
| 0.16 | 0.33 | 0.57 | 0.12 | 0.36 | 0.27 | 0.17 | |
| 0.51 | 0.50 | 0.17 | 0.16 | 0.16 | 0.24 | 0.40 | |
| 0.02 | 0.07 | 0.08 | 0.09 | 0.05 | 0.08 | ||
| 0.18 | 0.14 | 0.05 | |||||
| 0.00 | 2.85 | 8.52 | 9.88 | 9.80 | 9.72 | 1.38 | |
| 5.92 | 5.77 | 4.91 | 4.26 | 4.41 | 6.12 | ||
| 3.37 | 2.73 | 3.02 | 2.73 | 3.76 | 4.59 | 10.25 | |
| 88.85 | 68.11 | 47.98 | 41.44 | 27.93 | 14.72 | 12.15 | |
| 1.43 | |||||||
| 0.22 | 0.16 | 0.11 | 0.22 | 0.09 | |||
| 0.14 | 0.10 | ||||||
| 0.85 | |||||||
| 0.07 | 0.05 | 0.04 | 0.05 | 0.06 | |||
| 0.24 | 0.21 | 0.33 | 0.24 | 0.26 | 0.27 | ||
| 0.00 | 0.83 | 0.00 | 2.46 | 0.00 | 1.62 | 0.00 | |
| 33.38 | 8.46 | 6.71 | 6.20 | 3.55 | 3.44 | ||
| 5.70 | 4.22 | 2.88 | 2.55 | 4.13 | 3.39 | 2.98 | |
| 42.29 | 41.87 | 29.16 | 27.11 | 30.19 | 26.96 | 28.72 | |
| 0.00 | 0.00 | 0.00 | 0.03 | 0.00 | 0.00 | 0.00 | |
| 0.04 | 0.00 | 0.12 | 0.03 | 0.07 | 0.02 | ||
| 0.00 | 0.30 | 0.00 | 0.00 | 0.00 | 0.00 | 0.27 | |
| 0.37 | |||||||
| 0.17 | 0.15 | ||||||
| 34.85 | 39.25 | 47.86 | 36.10 | 39.77 | 39.64 | 44.21 | |
| 0.00 | 0.00 | 0.00 | |||||
| 0.46 | 0.33 | 0.45 | 0.31 | 0.24 | |||
| 0.35 | 0.11 | ||||||
| 0.00 | |||||||
| 0.10 | 0.24 | 0.14 | 0.07 | 0.11 | |||
| 0.00 | |||||||
| 0.44 | 0.00 | 0.42 | 0.20 | 0.60 | 0.78 | 0.00 | |
| 0.15 | |||||||
| 10.65 | 13.11 | 17.84 | 20.72 | 20.68 | 20.35 | 19.33 | |
| 0.28 | 0.25 | 0.29 | 0.23 | ||||
| 0.00 | |||||||
| 0.10 | 0.10 | 0.06 | 0.19 | 0.00 | 0.06 | 0.09 | |
| 1.58 | 2.53 | 1.74 | 1.11 | 2.06 | 1.91 | 1.11 | |
| 0.04 | 0.01 | 0.01 | 0.03 | 0.09 | 0.01 | ||
| 0.18 | 0.15 | 0.21 | 0.19 | 0.16 | 0.15 | 0.15 | |
| 0.15 | 0.17 | 0.23 | 0.25 | 1.23 | |||
| 3.30 | 2.89 | 6.12 | 3.29 | 2.00 | |||
| 0.85 | 0.24 | 0.76 | |||||
| 0.00 | 0.05 | 0.00 | 0.02 | 0.07 | |||
| 0.37 | |||||||
| 8.09 | 7.08 | 6.49 | 7.06 | 8.62 | 9.36 | 10.23 | |
| 6.44 | 6.67 | 5.49 | 4.61 | 5.36 | 4.35 | 4.80 | |
| 3.42 | 3.31 | 3.11 | 3.36 | 2.29 | 2.94 | ||
| 4.29 | 3.05 | 1.57 | 1.10 | ||||
| 15.90 | 18.38 | ||||||
| 60.69 | 39.76 | 33.50 | 18.86 | 12.59 | 25.21 | ||
| 18.06 | 12.37 | 17.36 | 22.32 | 26.16 | |||
| 27.37 | 22.74 | 20.90 | 9.53 | 17.20 | 20.13 | ||
| 0.19 | 0.17 | 0.42 | 0.55 | 0.35 | 0.27 | 0.12 | |
| 0.06 | 0.28 | 0.18 | 0.11 | 0.28 | 0.05 | 0.06 | |
| 0.05 | 0.05 | 0.14 | 0.09 | 0.33 | 0.00 | 0.00 | |
| 0.00 | |||||||
| 0.10 | 0.08 | 0.14 | 0.10 | 0.11 | 0.08 | 0.08 | |
| 0.21 | 0.22 | 0.24 | 0.34 | 0.07 | |||
| 2.58 | 1.36 | 3.37 | 1.67 | 2.14 | 2.61 | ||
| 0.34 | 0.30 | 0.40 | 0.42 | 0.44 | 0.46 | 0.43 | |
| 0.21 | 0.19 | 0.17 | 0.15 | 0.13 | 0.10 | 0.09 | |
| 0.06 | |||||||
| 0.10 | |||||||
| 1.81 | 1.46 | ||||||
| 23.28 | 25.50 | 27.65 | 28.49 | 20.55 | |||
| 0.43 | 0.43 | 0.56 | 0.66 | ||||
| 0.00 | 0.04 | ||||||
| 2.80 | 3.18 | 3.34 | 3.16 | 3.15 | 4.05 | ||
| 5.88 | 4.75 | 4.97 | 8.70 | 7.18 | 6.30 | 5.34 | |
| 0.03 | 0.02 | 0.01 | 0.01 | ||||
| 0.00 |
Table of death rates from firearms (including homicides) edit
This list is incomplete; you can help by adding missing items. (November 2011) |
This is a table which is giving information about "firearm-related death rate per 100,000 population per year".
- Unintentional: Unintentional shooting deaths.
- Undetermined: Shooting deaths in which the cause remains undecided.
| Location | Year | Total | Homicide | Suicide | Unintentional | Undetermined | Refs |
|---|---|---|---|---|---|---|---|
| 2016 | 3.2 | [4] | |||||
| 2018 | 5.72 | 2.80 | 1.05 | 0.10 | 1.77 | [5] | |
| 2019 | 0.88 | 0.15 | 0.72 | 0.00 | 0.03 | [6] | |
| 2016 | 2.75 | 0.10 | 2.44 | 0.01 | 0.11 | [7] | |
| mixed years | 0.23 | 0.20 (2017) | 0.01 | 0.02 | ? | [8] | |
| 2013 | 7.36 | 6.70 (2015) | 0.00 | 0.00 | 4.16 | [9] | |
| mixed years | ? | 0.14 (2009) | ? | ? | ? | [10] | |
| 2015 | 1.40 | 0.25 | 1.09 | 0.04 | 0.03 | [11] | |
| mixed years | ? | 0.74 (2010) | ? | ? | ? | [12] | |
| 2017 | 23.93 | 22.91 | 0.46 | 0.16 | 0.39 | [13] | |
| 2014 | 1.51 | 0.20 (2016) | 0.73 | 0.26 | 0.14 | [14] | |
| 2018 | 1.94 | 0.52 (2018) | 1.40 (2018) | 0.00 | 0.00 | [15] | |
| 2015 | 2.79 | 1.92 | 0.54 | 0.33 | 0.04 (2001) | [16] | |
| 2015 | 20.38 | 18.20 (2016) | 0.69 | 0.11 | 0.37 | [17] | |
| 2014 | 7.59 | 6.46 | 0.9 | 0.08 | 0.15 | [18] | |
| 2016 | 2.83 | 0.35 | 2.39 | 0.07 | 0.02 | [19] | |
| 2011 | 0.50 | 0.20 (2013) | 0.30 | 0.05 | 0.01 | [20] | |
| 2016 | 1.00 | 0.50 | 0.33 | 0.08 | 0.09 (2009) | [21] | |
| 2016 | 1.64 | 0.10 (2017) | 1.43 | 0.06 | 0.08 | [22] | |
| 2015 | 0.91 | 0.18 | 0.72 | 0.02 | 0.02 (2014) | [23] | |
| 2015 | 78.52 | 71.60 (2016) | 0.15 | 0.05 (2013) | 0.15 | [3] | |
| 2015 | 1.34 | 0.00 | 1.19 | 0.24 (2014) | 0.16 | [24] | |
| mixed years | 37.16 | 37.16 (2004) | ? | ? | ? | [25] | |
| 2015 | 2.41 | 0.20 (2016) | 2.17 | 0.02 | 0.02 | [26][27] | |
| 2014 | 2.33 | 0.12 | 1.64 | 0.03 | 0.53 | [28] | |
| 2019 | 1.44 | 0.62 | 0.47 | 0.35 | ? | [29] | |
| 2015 | 1.04 | 0.06 | 0.91 | 0.01 | 0.06 | [30] | |
| 2015 | 1.35 | 0.19 | 1.02 | 0.10 | 0.04 | [31] | |
| 2015 | 25.48 | 20.41 | 0.29 | 4.78 | 4.17 (2010) | [32] | |
| mixed years | 29.40 | 28.65 (2018) | 0.41 (2013) | 0.07 (2013) | 0.27 (2013) | [33] | |
| mixed years | 0.03 | 0.00 (2004) | 0.03 (1999) | 0.00 (1996) | 0.00 (1996) | [34] | |
| 2016 | 0.85 | 0.05 | 0.74 | 0.03 | 0.03 | [35] | |
| 2016 | 0.07 | 0.00 (2012) | 1.25 (2009) | ? | ? | [36] | |
| 2014 | 0.30 | 0.30 (2016) | 0.04 (2008) | 0.14 (2008) | ? | [37][38] | |
| 2014 | 0.87 | 0.21 | 0.62 | 0.02 | 0.02 | [39] | |
| 2015 | 1.38 | 0.68 | 0.43 | 0.21 (2014) | 0.22 | [40] | |
| 2015 | 1.13 | 0.29 | 0.72 | 0.12 | 0.00 | [41] | |
| 2015 | 35.22 | 38.20 (2016) | 0.31 | 0.14 (2011) | 7.84 (2011) | [42] | |
| 2015 | 0.02 | 0.00 | 0.01 | 0.00 | 0.00 | [43] | |
| mixed years | 0.36 | 0.36 (1995) | 0.00 (1999) | 0.00 (2000) | 0.00 (2000) | [44] | |
| 2015 | 0.72 | 0.30 | 0.07 | 0.19 | 0.16 | [45] | |
| 2015 | 1.86 | 0.40 | 1.16 | 0.05 (2014) | 0.30 | [46] | |
| 2015 | 1.23 | 0.18 | 0.88 | 0.00 (2014) | 0.18 | [47] | |
| 2015 | 11.55 | 16.50 (2017) | 0.46 | 0.47 | 0.36 | [48] | |
| 2016 | 0.77 | 0.31 | 0.26 | 0.06 | 0.14 | [49] | |
| 2009 | 8.68 | 2.50 (2016) | 6.59 | ? | ? | [50] | |
| 2016 | 0.42 | 0.16 | 0.24 | 0.01 | 0.00 (2015) | [51] | |
| 2015 | 1.24 | 0.20 (2016) | 0.92 (2015) | 0.14 (2015) | 0.02 | [52][53] | |
| 2018 | 7.09 | 6.22 | 0.17 | 0.46 | 0.24 | [54] | |
| 2013 | 1.19 | 1.10 (2014) | 0.67 (2013) | 0.00 (2013) | 0.00 (2013) | [55] | |
| 2015 | 1.48 | 0.06 | 1.40 | 0.00 (2014) | 0.00 (2014) | [56] | |
| 2015 | 9.95 | 9.30 | 0.14 | 0.05 | 0.46 | [57] | |
| 2014 | 6.32 | 6.00 (2015) | 1.06 | 0.27 | 0.24 | [58] | |
| 2015 | 3.72 | 3.20 (2016) | 0.01 (2015) | 0.12 (2015) | 0.29 (2015) | [59] | |
| 2011 | 7.72 | 7.62 | 0.03 | 0.03 | 0.01 | [60] | |
| 2015 | 0.20 | 0.03 | 0.10 | 0.02 | 0.04 | [61] | |
| 2014 | 1.48 | 0.24 | 1.12 | 0.01 | 0.10 | [62] | |
| ? | 0.15 | 0.15 (2004) | ? | ? | ? | [63] | |
| mixed years | 0.14 | 0.04 (2012) | 0.06 (2011) | 0.04 (2011) | 0.00 (2011) | [64] | |
| mixed years | ? | 0.90 (2013) | ? | ? | ? | [65] | |
| 2015 | 3.23 | 0.72 | 2.15 | 0.06 | 0.31 | [66] | |
| mixed years | 0.01 | 0.005 (1994-) | 0.0165 (1994-) | 0.003 (1994-) | 0.00 (1994-) | [2] | |
| 2014 | 1.89 | 0.30 | 0.97 | 0.37 | 0.35 | [67] | |
| 2015 | 1.91 | 0.00 (2016) | 1.71 | 0.05 | 0.05 | [68] | |
| 2015 | 10.47 | 12.92 (2018) | 1.80 (2009) | 10.25 | 0.01 | [69] | |
| 2015 | 0.06 | 0.03 | 0.01 | 0.01 | 0.01 | [70] | |
| 2015 | 0.57 | 0.10 (2016) | 0.43 (2015) | 0.05 (2015) | 0.01 (2015) | [71] | |
| 2016 | 1.31 | 0.40 (2017) | 0.96 | 0.01 | 0.04 | [72] | |
| 2022 | 1.96 | 0.12 | 1.76 | ? | 0.08 (Other than homicides & suicides) | [73][74] | |
| mixed years | 0.87 | 0.60 (2008) | 0.12 (1994) | 0.11 (1994) | 0.04 (1994) | [75] | |
| mixed years | 1.95 | 1.03 (2016) | 0.81 (2013) | 0.11 (2016) | 0.01 (2016) | [76][77] [78] | |
| 2016 | 1.36 | 1.36 (2016) | ? | ? | ? | [79] | |
| 2015 | 0.20 | 0.02 | 0.16 | 0.01 | 0.01 | [80] | |
| 2017 | 12.21 | 4.46 | 7.32 | 0.15 | 0.10 | [81] | |
| 2015 | 11.67 | 4.70 (2016) | 4.55 | 2.09 | 0.06 | [82] | |
| 2013 | 49.73 | 26.48 | 0.14 | 0.26 | 22.34 | [83] | |
| mixed years | 0.39 | 0.30 (2007) | 0.09 (1995) | ? | ? | [84] |
Charts and graphs edit


See also edit
- Firearm death rates in the United States by state
- List of countries by intentional homicide rate
- List of countries by suicide rate
- List of cities by murder rate
- List of U.S. states and territories by violent crime rate
- List of U.S. states and territories by intentional homicide rate
- List of United States cities by crime rate (250,000+)
- Percent of households with guns by country
- United States cities by crime rate (100,000–250,000)
- United States cities by crime rate (60,000-100,000)
- Index of gun politics articles
- Estimated number of civilian guns per capita by country
References edit
- ^ a b Homicide rate from firearms, 2005 to 2021. United Nations Office on Drugs and Crime – processed by Our World in Data. Click the download button for 2005-2021 data.
- ^ a b "Guns in Singapore: Facts, Figures and Firearm Law". Gunpolicy.org. University of Sydney School of Public Health. Archived from the original on 2015-04-30. Retrieved 2013-05-22.
- ^ a b "Guns in El Salvador: Facts, Figures and Firearm Law". Gunpolicy.org. University of Sydney School of Public Health. Archived from the original on 22 June 2013. Retrieved 13 October 2020.
- ^ Global Mortality From Firearms, 1990-2016. August 28, 2018. JAMA. 2018;320(8):792-814. doi:10.1001/jama.2018.10060. Free access to PDF, etc. via free registration. Main table via table tab without logging in.
- ^ "Guns in Argentina: Facts, Figures and Firearm Law". Gunpolicy.org. University of Sydney School of Public Health. 2014-10-15. Archived from the original on 2014-10-19. Retrieved 25 May 2022.
- ^ "Guns in Australia: Facts, Figures and Firearm Law". Gunpolicy.org. University of Sydney School of Public Health. 2014-10-15. Archived from the original on 2014-10-19. Retrieved 13 October 2020.
- ^ "Guns in Austria: Facts, Figures and Firearm Law". Gunpolicy.org. University of Sydney School of Public Health. 2013-05-16. Archived from the original on 2020-11-02. Retrieved 15 October 2020.
- ^ "Guns in Azerbaijan: Facts, Figures and Firearm Law". Gunpolicy.org. University of Sydney School of Public Health. 2013-05-16. Archived from the original on 2020-11-04. Retrieved 15 October 2020.
- ^ "Guns in Barbados: Facts, Figures and Firearm Law". Gunpolicy.org. University of Sydney School of Public Health. 2013-05-19. Archived from the original on 2020-10-30. Retrieved 15 October 2020.
- ^ "Guns in Belarus: Facts, Figures and Firearm Law". Gunpolicy.org. University of Sydney School of Public Health. 2013-05-19. Archived from the original on 2017-10-05. Retrieved 4 October 2017.
- ^ "Guns in Belgium: Facts, Figures and Firearm Law". Gunpolicy.org. University of Sydney School of Public Health. 2013-05-19. Archived from the original on 2013-02-06. Retrieved 13 October 2020.
- ^ "Guns in Bolivia: Facts, Figures and Firearm Law". Gunpolicy.org. University of Sydney School of Public Health. 2015-12-12. Archived from the original on 2017-10-05. Retrieved 4 October 2017.
- ^ "Guns in Brazil". GunPolicy.org. Archived from the original on 20 December 2012. Retrieved 13 October 2020.
- ^ "Guns in Bulgaria: Facts, Figures and Firearm Law". Gunpolicy.org. University of Sydney School of Public Health. 2013-05-19. Archived from the original on 2020-11-11. Retrieved 13 October 2020.
- ^ "Guns in Canada: Facts, Figures and Firearm Law". Gunpolicy.org. University of Sydney School of Public Health. Archived from the original on 14 October 2020. Retrieved 13 October 2020.
- ^ "Chile — Gun Facts, Figures and the Law". Gunpolicy.org. University of Sydney School of Public Health. Archived from the original on 26 June 2019. Retrieved 7 August 2019.
- ^ "Colombia — Gun Facts, Figures and the Law". Gunpolicy.org. University of Sydney School of Public Health. Archived from the original on 22 December 2012. Retrieved 13 October 2020.
- ^ "Costa Rica — Gun Facts, Figures and the Law". Gunpolicy.org. University of Sydney School of Public Health. Archived from the original on 3 July 2019. Retrieved 7 August 2019.
- ^ "Croatia — Gun Facts, Figures and the Law". Gunpolicy.org. University of Sydney School of Public Health. Archived from the original on 7 September 2019. Retrieved 7 August 2019.
- ^ "Guns in Cuba: Gun Facts, Figures and the Law". Gunpolicy.org. University of Sydney School of Public Health. Archived from the original on 24 February 2018. Retrieved 23 February 2018.
- ^ "Guns in Cyprus: Facts, Figures and Firearm Law". Gunpolicy.org. University of Sydney School of Public Health. Archived from the original on 19 March 2013. Retrieved 13 October 2020.
- ^ "Guns in Czech Republic: Facts, Figures and Firearm Law". Gunpolicy.org. University of Sydney School of Public Health. Archived from the original on 24 June 2013. Retrieved 13 October 2020.
- ^ "Guns in Denmark: Facts, Figures and Firearm Law". Gunpolicy.org. University of Sydney School of Public Health. Archived from the original on 5 October 2014. Retrieved 13 October 2020.
- ^ "Guns in Estonia: Facts, Figures and Firearm Law". Gunpolicy.org. University of Sydney School of Public Health. Archived from the original on 6 February 2013. Retrieved 13 October 2020.
- ^ "Guns in Swaziland: Facts, Figures and Firearm Law". Gunpolicy.org. University of Sydney School of Public Health. Archived from the original on 1 October 2013. Retrieved 22 May 2013.
- ^ "Guns in Finland: Facts, Figures and Firearm Law". Gunpolicy.org. University of Sydney School of Public Health. Archived from the original on 6 February 2013. Retrieved 12 October 2020.
- ^ ""Something terrible has happened": Does Finland need to wake up to its gun problem?". 21 December 2015. Archived from the original on 31 December 2015. Retrieved 30 December 2015.
- ^ "Guns in France: Facts, Figures and Firearm Law". Gunpolicy.org. University of Sydney School of Public Health. Archived from the original on 13 October 2020. Retrieved 13 October 2020.
- ^ "Guns in Georgia: Facts, Figures and Firearm Law". Gunpolicy.org. University of Sydney School of Public Health. Archived from the original on 27 November 2013. Retrieved 15 October 2020.
- ^ "Guns in Germany: Facts, Figures and Firearm Law". Gunpolicy.org. University of Sydney School of Public Health. Archived from the original on 5 July 2013. Retrieved 19 May 2013.
- ^ "Guns in Greece: Facts, Figures and Firearm Law". Gunpolicy.org. University of Sydney School of Public Health. Archived from the original on 22 June 2013. Retrieved 13 October 2020.
- ^ "Guns in Guatemala: Facts, Figures and Firearm Law". Gunpolicy.org. University of Sydney School of Public Health. Archived from the original on 22 June 2013. Retrieved 13 October 2020.
- ^ "Guns in Honduras: Facts, Figures and Firearm Law". Gunpolicy.org. University of Sydney School of Public Health. Archived from the original on 31 March 2013. Retrieved 13 October 2020.
- ^ "Guns in Hong Kong: Facts, Figures and Firearm Law". Gunpolicy.org. University of Sydney School of Public Health. Archived from the original on 27 September 2013. Retrieved 19 May 2013.
- ^ "Guns in Hungary: Facts, Figures and Firearm Law". Gunpolicy.org. University of Sydney School of Public Health. Archived from the original on 29 September 2013. Retrieved 13 October 2020.
- ^ "US vs. Other Countries: Gun Violence". npr.org. National Public Radio (NPR). Archived from the original on 6 October 2017. Retrieved 6 October 2017.
- ^ "Guns in India: Facts, Figures and Firearm Law". Gunpolicy.org. University of Sydney School of Public Health. Archived from the original on 15 April 2013. Retrieved 15 October 2020.
- ^ "Victims Murdered by use of Fire Arms – 2016" (PDF). [National Crime Records Bureau]. Archived (PDF) from the original on 12 January 2019. Retrieved 12 January 2019.
- ^ "Guns in Ireland: Facts, Figures and Firearm Law". Gunpolicy.org. University of Sydney School of Public Health. Archived from the original on 8 July 2019. Retrieved 4 August 2019.
- ^ "Guns in Israel: Facts, Figures and Firearm Law". Gunpolicy.org. University of Sydney School of Public Health. Archived from the original on 25 August 2020. Retrieved 13 October 2020.
- ^ "Guns in Italy: Facts, Figures and Firearm Law". Gunpolicy.org. University of Sydney School of Public Health. Archived from the original on 29 September 2013. Retrieved 13 October 2020.
- ^ "Guns in Jamaica: Facts, Figures and Firearm Law". Gunpolicy.org. University of Sydney School of Public Health. Archived from the original on 22 June 2013. Retrieved 13 October 2020.
- ^ "Guns in Japan: Facts, Figures and Firearm Law". Gunpolicy.org. University of Sydney School of Public Health. Archived from the original on 14 April 2013. Retrieved 13 October 2020.
- ^ "Guns in Kuwait: Facts, Figures and Firearm Law". Gunpolicy.org. University of Sydney School of Public Health. Archived from the original on 2 October 2013. Retrieved 19 May 2013.
- ^ "Guns in Kyrgyzstan: Facts, Figures and Firearm Law". Gunpolicy.org. University of Sydney School of Public Health. Archived from the original on 1 October 2013. Retrieved 15 October 2020.
- ^ "Guns in Latvia: Facts, Figures and Firearm Law". Gunpolicy.org. University of Sydney School of Public Health. Archived from the original on 28 April 2013. Retrieved 13 October 2020.
- ^ "Guns in Luxembourg: Facts, Figures and Firearm Law". Gunpolicy.org. University of Sydney School of Public Health. Archived from the original on 27 September 2013. Retrieved 13 October 2020.
- ^ "Guns in Mexico: Facts, Figures and Firearm Law". Gunpolicy.org. University of Sydney School of Public Health. Archived from the original on 27 January 2013. Retrieved 13 October 2020.
- ^ "Guns in Moldova: Facts, Figures and Firearm Law". Gunpolicy.org. University of Sydney School of Public Health. Archived from the original on 27 January 2013. Retrieved 13 October 2020.
- ^ "Guns in Montenegro: Facts, Figures and Firearm Law". Gunpolicy.org. University of Sydney School of Public Health. Archived from the original on 27 January 2013. Retrieved 15 October 2020.
- ^ "Guns in Netherlands: Facts, Figures and Firearm Law". Gunpolicy.org. University of Sydney School of Public Health. Archived from the original on 10 March 2013. Retrieved 28 Jan 2020.
- ^ "Guns in New Zealand: Facts, Figures and Firearm Law". Gunpolicy.org. University of Sydney School of Public Health. Archived from the original on 29 March 2013. Retrieved 15 October 2020.
- ^ Flahive, Brad; Fyers, Andy (2017-10-04). "'Opportunity missed' for NZ to tighten gun control laws". Stuff. Archived from the original on 2021-05-25. Retrieved 2018-11-08.
- ^ "Guns in Nicaragua: Facts, Figures and Firearm Law". Gunpolicy.org. University of Sydney School of Public Health. Archived from the original on 15 June 2013. Retrieved 15 October 2020.
- ^ "Guns in Macedonia: Facts, Figures and Firearm Law". Gunpolicy.org. University of Sydney School of Public Health. Archived from the original on 27 January 2013. Retrieved 15 October 2020.
- ^ "Guns in Norway: Facts, Figures and Firearm Law". Gunpolicy.org. University of Sydney School of Public Health. Archived from the original on 15 April 2013. Retrieved 13 October 2020.
- ^ "Guns in Panama: Facts, Figures and Firearm Law". Gunpolicy.org. University of Sydney School of Public Health. Archived from the original on 22 June 2013. Retrieved 13 October 2020.
- ^ "Guns in Paraguay: Facts, Figures and Firearm Law". Gunpolicy.org. University of Sydney School of Public Health. Archived from the original on 15 September 2013. Retrieved 15 October 2020.
- ^ "Guns in Peru: Facts, Figures and Firearm Law". Gunpolicy.org. University of Sydney School of Public Health. Archived from the original on 15 September 2013. Retrieved 15 October 2020.
- ^ "Guns in Philippines: Facts, Figures and Firearm Law". Gunpolicy.org. University of Sydney School of Public Health. Archived from the original on 3 July 2013. Retrieved 13 October 2020.
- ^ "Guns in Poland: Facts, Figures and Firearm Law". Gunpolicy.org. University of Sydney School of Public Health. Archived from the original on 27 September 2013. Retrieved 13 October 2020.
- ^ "Guns in Portugal: Facts, Figures and Firearm Law". Gunpolicy.org. University of Sydney School of Public Health. Archived from the original on 27 September 2013. Retrieved 13 October 2020.
- ^ "Guns in Qatar: Facts, Figures and Firearm Law". Gunpolicy.org. University of Sydney School of Public Health. Archived from the original on 2013-04-13. Retrieved 2013-05-22.
- ^ "Guns in Romania: Facts, Figures and Firearm Law". Gunpolicy.org. University of Sydney School of Public Health. Archived from the original on 2013-09-30. Retrieved 2013-05-22.
- ^ "Guns in Russia: Facts, Figures and Firearm Law". Gunpolicy.org. University of Sydney School of Public Health. Archived from the original on 2021-04-01. Retrieved 2021-03-23.
- ^ "Guns in Serbia: Facts, Figures and Firearm Law". Gunpolicy.org. University of Sydney School of Public Health. Archived from the original on 29 April 2013. Retrieved 13 October 2020.
- ^ "Guns in Slovakia: Facts, Figures and Firearm Law". Gunpolicy.org. University of Sydney School of Public Health. Archived from the original on 14 September 2013. Retrieved 15 October 2020.
- ^ "Guns in Slovenia: Facts, Figures and Firearm Law". Gunpolicy.org. University of Sydney School of Public Health. Archived from the original on 27 September 2013. Retrieved 13 October 2020.
- ^ "Guns in South Africa: Facts, Figures and Firearm Law". Gunpolicy.org. University of Sydney School of Public Health. Archived from the original on 12 July 2013. Retrieved 13 October 2020.
- ^ "Guns in South Korea: Facts, Figures and Firearm Law". Gunpolicy.org. University of Sydney School of Public Health. Archived from the original on 1 July 2013. Retrieved 13 October 2020.
- ^ "Guns in Spain: Facts, Figures and Firearm Law". Gunpolicy.org. University of Sydney School of Public Health. Archived from the original on 27 September 2013. Retrieved 13 October 2020.
- ^ "Guns in Sweden: Facts, Figures and Firearm Law". Gunpolicy.org. University of Sydney School of Public Health. Archived from the original on 29 June 2013. Retrieved 13 October 2020.
- ^ "Homicides: crimes solved and trend by instrument (perpetrated and attempted), number of accused persons and victims - 2009-2022". Federal Statistical Office. 27 March 2023. Archived from the original on 2023-10-27. Retrieved 2024-01-06.
- ^ "Décès dus aux armes à feu selon le sexe - 1995-2022". Federal Statistical Office. 11 December 2023. Archived from the original on 2024-01-06. Retrieved 2024-01-06.
- ^ "Guns in Taiwan: Facts, Figures and Firearm Law". Gunpolicy.org. University of Sydney School of Public Health. Archived from the original on 2013-03-31. Retrieved 2013-05-22.
- ^ "Suicide Statistics 2013". Turkish Statistical Institute. Archived from the original on 16 February 2016. Retrieved 28 August 2016.
- ^ "Turkish Homicide Statistics". Hurriyet Newspaper. Hurriyet. 24 January 2016. Archived from the original on 12 November 2016. Retrieved 28 August 2016.
- ^ "Turkish Homicide by Firearms Statistics". Milliyet Newspaper. milliyet. 5 February 2016. Archived from the original on 14 October 2016. Retrieved 28 August 2016.
- ^ "У 2016 році в Україні зросла кількість злочинів, зокрема - тяжких на 20%. Детальна статистика" [In 2016 the number of crimes in Ukraine has increased, detailed statistics]. Gunpolicy.org. University of Sydney School of Public Health. Archived from the original on 2017-01-24. Retrieved 2013-05-22.
- ^ "Guns in the United Kingdom: Facts, Figures and Firearm Law". Gunpolicy.org. University of Sydney School of Public Health. 22 May 2013. Archived from the original on 2 February 2013. Retrieved 12 October 2020.
- ^ "Guns in the United States: Facts, Figures and Firearm Law". Gunpolicy.org. University of Sydney School of Public Health. Archived from the original on 2012-12-20. Retrieved 2019-08-07.
- ^ "Guns in Uruguay: Facts, Figures and Firearm Law". Gunpolicy.org. University of Sydney School of Public Health. Archived from the original on 1 July 2013. Retrieved 13 October 2020.
- ^ "Venezuela — Gun Facts, Figures and the Law". Gunpolicy.org. University of Sydney School of Public Health. Archived from the original on 12 January 2014. Retrieved 13 October 2020.
- ^ "Guns in Zimbabwe: Facts, Figures and Firearm Law". Gunpolicy.org. University of Sydney School of Public Health. Archived from the original on 2013-01-27. Retrieved 2013-05-22.
- ^ Grinshteyn, Erin; Hemenway, David (March 2016). "Violent Death Rates: The US Compared with Other High-income OECD Countries, 2010". The American Journal of Medicine. 129 (3): 266–273. doi:10.1016/j.amjmed.2015.10.025. PMID 26551975. (Table 4). (PDF [https://web.archive.org/web/20190202104515/https://www.amjmed.com/article/S0002-9343(15)01030-X/pdf Archived 2019-02-02 at the Wayback Machine).
- ^ "Home >> Intentional Homicide Victims". dataunodc.un.org. United Nations Office on Drugs and Crime. Retrieved 23 October 2020.
- ^ Fox, Kara; Shveda, Krystina; Croker, Natalie; Chacon, Marco (November 26, 2021). "How US gun culture stacks up with the world". CNN. Archived from the original on November 26, 2021.
CNN's attribution: Developed countries are defined based on the UN classification, which includes 36 countries. Source: Institute for Health Metrics and Evaluation (Global Burden of Disease 2019), Small Arms Survey (Civilian Firearm Holdings 2017)
External links edit
- Systematic comparison of 195 countries and territories for the period from 1990 to 2016: Naghavi, Mohsen; et al. (28 August 2018). "Global Mortality From Firearms, 1990-2016". JAMA. 320 (8): 792–814. doi:10.1001/jama.2018.10060. ISSN 0098-7484. PMC 6143020. PMID 30167700. [1]
- "Murder Victims by Weapon, 2013–2017". Uniform Crime Reports for 2017. FBI.
- "Fatal Injury Data". Centers for Disease Control. January 18, 2019. Retrieved 29 March 2019.
- "Fatal Injury Mapping". Centers for Disease Control. Archived from the original on 2012-01-25. Retrieved 29 March 2019.
- "Statistics and Data: Crime Data". dataunodc.un.org. United Nations Office on Drugs and Crime (UNODC).
- Historic data can be found on the United Nations Survey on Crime Trends and the Operations of Criminal Justice Systems (UN-CTS) page.
- "International Homicide Comparisons". GunCite.com. May 20, 2006. Retrieved 2008-04-08.
- "Global Impacts of Gun Violence". gunpolicy.org. Retrieved 2012-02-10.
- "Deaths Due to Injury by Firearms per 100,000 Population". StateHealthFacts.org. Kaiser Family Foundation. Retrieved 2008-04-08.
- Greg Barrow (2000-02-15). "SA gun deaths rise". BBC News.
- "Victims of crime survey 2011" (PDF). statssa.gov.za. Statistics, South African Government.
- Centers for Disease Control (CDC) Fast Facts - Suicide and Self Injury, Injuries, and Homicide
- "European Detailed Mortality Database". data.euro.who.int. World Health Organization, Regional office for Europe.
- "CoDQL (Cause of Death Query online)". World Health Organization. Archived from the original on January 15, 2015. —Causes of death by year from countries that have reported to the WHO. Firearm deaths correspond to ICD-10 codes W32-W34, Accidental discharge of firearm; X72-X74, Intentional self-harm by firearm; X93-X95, Assault by firearm; Y22-Y24, Firearm discharge, undetermined intent.
- Krug, EG; Powell, KE; Dahlberg, LL (1998). "Firearm-related deaths in the United States and 35 other high- and upper-middle-income countries". International Journal of Epidemiology. 27 (2): 214–221. doi:10.1093/ije/27.2.214. PMID 9602401. —Contains statistics from 36 countries between 1990 and 1995.