


Summary
The 1994 United States House of Representatives elections were held on November 8, 1994, to elect U.S. Representatives to serve in the 104th United States Congress. They occurred in the middle of President Bill Clinton's first term. In what was known as the Republican Revolution, a 54-seat swing in membership from the Democratic Party to the Republican Party resulted in the latter gaining a majority of seats in the House of Representatives for the first time since 1952. It was also the largest seat gain for the party since 1946, and the largest for either party since 1948, and characterized a political realignment in American politics.
| ||||||||||||||||||||||||||||||||||||||||||||||||||||||||||||||
All 435 seats in the United States House of Representatives 218 seats needed for a majority | ||||||||||||||||||||||||||||||||||||||||||||||||||||||||||||||
|---|---|---|---|---|---|---|---|---|---|---|---|---|---|---|---|---|---|---|---|---|---|---|---|---|---|---|---|---|---|---|---|---|---|---|---|---|---|---|---|---|---|---|---|---|---|---|---|---|---|---|---|---|---|---|---|---|---|---|---|---|---|---|
| ||||||||||||||||||||||||||||||||||||||||||||||||||||||||||||||
 Results: Democratic hold Democratic gain Republican hold Republican gain Independent hold | ||||||||||||||||||||||||||||||||||||||||||||||||||||||||||||||
| ||||||||||||||||||||||||||||||||||||||||||||||||||||||||||||||
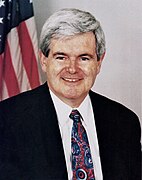

Democrats had run the House since 1955, and for all but four years (1947–49 and 1953–55) since 1931. But in 1994, the Republican Party ran against President Clinton's proposed healthcare reform.[1] The Republicans argued that Clinton had abandoned the centrist New Democrat platform he campaigned on during the 1992 presidential election and reverted to big government solutions. The GOP ran on Newt Gingrich's Contract with America.
The incumbent Speaker of the House, Democrat Tom Foley, lost re-election in his district, becoming the first sitting speaker to be defeated since Galusha Grow in 1863.[2] Other major upsets included the defeat of powerful long-serving representatives such as Ways and Means chairman Dan Rostenkowski and Judiciary chairman Jack Brooks. In all, 34 incumbents, all Democrats, were defeated. Republicans also won a number of seats held by retiring Democrats. No Republican incumbents lost re-election, but Democrats won four open Republican-held seats. NFL Hall of Famer Steve Largent was elected in Oklahoma and singer Sonny Bono was elected in California.
Robert H. Michel, the Republican minority leader, chose to retire due to pressure from the more conservative members of the Republican caucus. Dick Cheney had served as the Minority Whip and Michel supported having Edward Rell Madigan replace him, but the position was instead given to Gingrich, who would later be selected to become speaker.[3] The incumbent Democratic majority leader, Dick Gephardt, became minority leader. The new House leadership, under the Republicans, promised to bring a dozen legislative proposals to a vote in the first 100 days of the session, although the Senate did not always follow suit. In a significant political realignment, the South underwent a dramatic transformation. Before the election, House Democrats outnumbered House Republicans in the South. Afterwards, with the Republicans having picked up a total of 19 Southern seats, they were able to outnumber Democrats in the South for the first time since Reconstruction.[4] The Republicans would go on to remain the majority party of the House for the following 12 years, until the 2006 elections. The Republicans have won at least 200 seats in almost every House election since, with the exceptions of 2008 and 2018.
As of 2023[update], this is the last congressional election in which Democrats won a House seat in Montana, as well as the last time Republicans won any House seats in Massachusetts.
Voting patterns edit
Republican gains, 1992–1994 edit
| Category | % Rep. 1992 |
% Rep. 1994 |
% shift to Republican 1992–94 |
size of group % /all |
|---|---|---|---|---|
| Southern whites | 53 | 65 | 12 | 24 |
| White men | 51 | 62 | 11 | 40 |
| White "born again" Christian | 66 | 76 | 10 | 20 |
| Whites 30–44 years old | 51 | 61 | 10 | 28 |
| Independents | 46 | 56 | 10 | 24 |
| White Protestants | 57 | 66 | 9 | 41 |
| Whites 60 and over | 46 | 55 | 9 | 26 |
| Whites | 50 | 58 | 8 | 79 |
| Men 30–44 years old | 49 | 57 | 8 | 17 |
| Republicans | 85 | 93 | 8 | 35 |
| Income under $15,000 | 31 | 38 | 7 | 11 |
| Conservatives | 72 | 79 | 7 | 34 |
| Men 60 and over | 44 | 51 | 7 | 12 |
| Whites 45-59 | 52 | 59 | 7 | 23 |
| Men | 48 | 54 | 6 | 49 |
| High school education | 42 | 48 | 6 | 22 |
| Some college | 47 | 53 | 6 | 32 |
| White women | 49 | 55 | 6 | 40 |
| Unmarried men | 42 | 48 | 6 | 14 |
| Country on "wrong track" | -- | 67 | 59 | |
| Disapprove of Clinton | -- | 82 | 49 | |
| 1992 Perot voters | -- | 67 | 12 |
- Source: Data from exit-poll surveys by Voter Research and Surveys and Mitofsky International published in The New York Times, November 13, 1994, p. 24.
Religious right edit
Evangelicals were an important group within the electorate and a significant voting block in the Republican party. The national exit poll by Mitofsky International showed 27% of all voters identified themselves as a born-again or evangelical Christians, up from 18% in 1988 and 24% in 1992. Republican House candidates outpolled Democrats among white evangelicals by a massive 52 points, 76% to 24%.[5]
According to a survey sponsored by the Christian Coalition, 33 percent of the 1994 voters were "religious conservatives," up from 24 percent in 1992 and 18 percent in 1988 (CQ Weekly Report), November 19, 1994, p. 3364; in the 1994 exit poll, 38 percent identified themselves as "conservatives," compared with 30 percent in 1992.[6]
- Party identification and ideology by selected religious groups 1994
| Party identification | Political ideology | ||||
|---|---|---|---|---|---|
| Religion | Democratic | Republican | Liberal | Moderate | Conservative |
| White evangelical | 20 | 54 | 6 | 33 | 61 |
| Highly religious | 34 | 39 | 15 | 48 | 37 |
| Secular | 44 | 27 | 31 | 47 | 22 |
| Jewish | 57 | 13 | 36 | 50 | 14 |
| All voters | 41 | 35 | 18 | 47 | 35 |
- Source: Mitofsky International exit poll in Klinkner, p. 121.
Overall results edit
| 204 | 1 | 230 |
| Democratic | I | Republican |
| Party | Seats | Seat percentage | Vote percentage | Popular vote | |||
|---|---|---|---|---|---|---|---|
| 1992 | Elected | Net change | |||||
| Republican | 176 | 230 | 52.9% | 51.5% | 36,325,809 | ||
| Democratic | 258 | 204 | 46.9% | 44.7% | 31,542,823 | ||
| Independent | 1 | 1 | 0.2% | 0.7% | 497,403 | ||
| Libertarian | 0 | 0 | 0.0% | 0.6% | 415,944 | ||
| Conservative | 0 | 0 | 0.0% | 0.4% | 302,735 | ||
| U.S. Taxpayers' | 0 | 0 | 0.0% | 0.1% | 90,793 | ||
| Right to Life | 0 | 0 | 0.0% | 0.1% | 70,526 | ||
| Peace and Freedom | 0 | 0 | 0.0% | 0.1% | 63,450 | ||
| Natural Law | 0 | 0 | 0.0% | 0.1% | 62,556 | ||
| Green Party | 0 | 0 | 0.0% | 0.1% | 40,177 | ||
| Others | 0 | 0 | 0.0% | 1.5% | 1,081,432 | ||
| Totals | 435 | 435 | 100.0% | 100.0% | 70,493,648 | ||
Source: Election Statistics - Office of the Clerk
Maps edit
-
 Popular vote by states
 -
 House results shaded by winners share of vote
 -
 House seats by party holding plurality in state
 -
 Net changes to U.S. House seats after the 1994 elections


Incumbents defeated edit
In primary elections edit
Democrats edit
- Oklahoma 2: Mike Synar lost to Virgil R. Cooper, who later lost the general election to Republican Tom Coburn
- Pennsylvania 2: Lucien E. Blackwell lost to Chaka Fattah, who later won the general election
- Texas 18: Craig Washington lost to Sheila Jackson Lee, who later won the general election
Republicans edit
- New York 4: David A. Levy lost to Dan Frisa, who later won the general election
In the general elections edit
Democrats edit
Thirty-four incumbent Democrats (including 16 "freshmen") were defeated in 1994. Democrats from Washington lost the most seats (5).
- Arizona 6: Karan English
- California 1: Dan Hamburg
- California 19: Richard H. Lehman
- California 49: Lynn Schenk
- Georgia 7: George Darden
- Georgia 10: Don Johnson Jr.
- Idaho 1: Larry LaRocco
- Illinois 5: Dan Rostenkowski
- Indiana 4: Jill Long
- Indiana 8: Frank McCloskey
- Iowa 4: Neal Edward Smith
- Kansas 4: Dan Glickman
- Kentucky 1: Thomas Barlow
- Nebraska 2: Peter Hoagland
- Nevada 1: James Bilbray
- New Hampshire 2: Richard Swett
- New Jersey 8: Herb Klein
- New York 1: George J. Hochbrueckner
- North Carolina 3: Martin Lancaster
- North Carolina 4: David Price
- Ohio 1: David S. Mann
- Ohio 6: Ted Strickland
- Ohio 19: Eric Fingerhut
- Pennsylvania 13: Marjorie Margolies-Mezvinsky
- Texas 9: Jack Brooks
- Texas 13: Bill Sarpalius
- Utah 2: Karen Shepherd
- Virginia 11: Leslie Byrne
- Washington 1: Maria Cantwell
- Washington 3: Jolene Unsoeld
- Washington 4: Jay Inslee
- Washington 5: Tom Foley
- Washington 9: Mike Kreidler
- Wisconsin 1: Peter W. Barca
Republicans edit
- None.
Open seats that changed parties edit
Democratic seats won by Republicans edit
22 open seats previously held by Democrats were won by Republicans.
- Arizona 1: Matt Salmon
- Florida 1: Joe Scarborough
- Florida 15: Dave Weldon
- Georgia 8: Saxby Chambliss
- Illinois 11: Jerry Weller
- Indiana 2: David M. McIntosh
- Kansas 2: Sam Brownback
- Maine 1: James B. Longley Jr.
- Michigan 8: Dick Chrysler
- Minnesota 1: Gil Gutknecht
- Mississippi 1: Roger Wicker
- New Jersey 2: Frank LoBiondo
- North Carolina 2: David Funderburk
- North Carolina 5: Richard Burr
- Ohio 18: Bob Ney
- Oklahoma 2: Tom Coburn
- Oklahoma 4: J. C. Watts
- Oregon 5: Jim Bunn
- South Carolina 3: Lindsey Graham
- Tennessee 3: Zach Wamp
- Tennessee 4: Van Hilleary
- Washington 2: Jack Metcalf
Republican seats won by Democrats edit
Democrats won four open seats previously held by Republicans.
Open seats that parties held edit
Democratic seats held edit
Democrats held nine of their open seats.
- California 16: Zoe Lofgren
- Kentucky 3: Mike Ward
- Michigan 13: Lynn N. Rivers
- Missouri 5: Karen McCarthy
- Pennsylvania 2: Chaka Fattah
- Pennsylvania 20: Frank Mascara
- Texas 10: Lloyd Doggett
- Texas 18: Sheila Jackson Lee
- Texas 25: Ken Bentsen Jr.
Republican seats held edit
Republicans held 17 of their open seats.
- Arizona 4: John Shadegg
- California 22: Andrea Seastrand
- California 44: Sonny Bono
- Florida 16: Mark Foley
- Illinois 18: Ray LaHood
- Iowa 5: Tom Latham
- Maryland 2: Bob Ehrlich
- New Jersey 11: Rodney Frelinghuysen
- New York 4: Dan Frisa
- New York 19: Sue W. Kelly
- North Carolina 9: Sue Myrick
- Oklahoma 1: Steve Largent
- Oregon 2: Wes Cooley
- Pennsylvania 21: Phil English
- South Carolina 1: Mark Sanford
- Tennessee 7: Ed Bryant
- Wyoming at-large: Barbara Cubin
Special elections edit
| District | Predecessor | Party | First elected | Results Sorted by election date | Candidates |
|---|---|---|---|---|---|
| Oklahoma 6 | Glenn English | Democratic | 1974 | Incumbent resigned January 7, 1994 to become vice president and general manager of the National Rural Electric Cooperative Association. Winner elected May 10, 1994. Republican gain. Winner was subsequently re-elected in November. |
|
| Kentucky 2 | William Natcher | Democratic | 1953 (Special) | Incumbent died March 29, 1994. Winner elected May 24, 1994. Republican gain. Winner was subsequently re-elected in November. |
|
Alabama edit
| District | Incumbent | This race | |||
|---|---|---|---|---|---|
| Representative | Party | First elected |
Results | Candidates | |
| Alabama 1 | Sonny Callahan | Republican | 1984 | Incumbent re-elected. |
|
| Alabama 2 | Terry Everett | Republican | 1992 | Incumbent re-elected. |
|
| Alabama 3 | Glen Browder | Democratic | 1989 (special) | Incumbent re-elected. |
|
| Alabama 4 | Tom Bevill | Democratic | 1966 | Incumbent re-elected. |
|
| Alabama 5 | Bud Cramer | Democratic | 1990 | Incumbent re-elected. |
|
| Alabama 6 | Spencer Bachus | Republican | 1992 | Incumbent re-elected. |
|
| Alabama 7 | Earl Hilliard | Democratic | 1992 | Incumbent re-elected. |
|
Alaska edit
| District | Incumbent | This race | |||
|---|---|---|---|---|---|
| Representative | Party | First elected |
Results | Candidates | |
| Alaska at-large | Don Young | Republican | 1973 (special) | Incumbent re-elected. |
|
Arizona edit
| District | Incumbent | This race | |||
|---|---|---|---|---|---|
| Representative | Party | First elected |
Results | Candidates | |
| Arizona 1 | Sam Coppersmith | Democratic | 1992 | Incumbent retired to run for U.S. Senator. New member elected. Republican gain. |
|
| Arizona 2 | Ed Pastor | Democratic | 1991 (special) | Incumbent re-elected. |
|
| Arizona 3 | Bob Stump | Republican | 1976[a] | Incumbent re-elected. |
|
| Arizona 4 | Jon Kyl | Republican | 1986 | Incumbent retired to run for U.S. Senator. New member elected. Republican hold. |
|
| Arizona 5 | Jim Kolbe | Republican | 1984 | Incumbent re-elected. |
|
| Arizona 6 | Karan English | Democratic | 1992 | Incumbent lost re-election. New member elected. Republican gain. |
|
Arkansas edit
| District | Incumbent | This race | |||
|---|---|---|---|---|---|
| Representative | Party | First elected |
Results | Candidates | |
| Arkansas 1 | Blanche Lincoln | Democratic | 1992 | Incumbent re-elected. |
|
| Arkansas 2 | Ray Thornton | Democratic | 1972 1978 (retired) 1990 |
Incumbent re-elected. |
|
| Arkansas 3 | Tim Hutchinson | Republican | 1992 | Incumbent re-elected. |
|
| Arkansas 4 | Jay Dickey | Republican | 1992 | Incumbent re-elected. |
|
California edit
| District | Incumbent | This race | |||
|---|---|---|---|---|---|
| Representative | Party | First elected |
Results | Candidates | |
| California 1 | Dan Hamburg | Democratic | 1992 | Incumbent lost re-election. New member elected. Republican gain. |
|
| California 2 | Wally Herger | Republican | 1986 | Incumbent re-elected. |
|
| California 3 | Vic Fazio | Democratic | 1978 | Incumbent re-elected. |
|
| California 4 | John Doolittle | Republican | 1990 | Incumbent re-elected. |
|
| California 5 | Bob Matsui | Democratic | 1978 | Incumbent re-elected. |
|
| California 6 | Lynn Woolsey | Democratic | 1992 | Incumbent re-elected. |
|
| California 7 | George Miller | Democratic | 1974 | Incumbent re-elected. |
|
| California 8 | Nancy Pelosi | Democratic | 1987 | Incumbent re-elected. |
|
| California 9 | Ron Dellums | Democratic | 1970 | Incumbent re-elected. |
|
| California 10 | Bill Baker | Republican | 1992 | Incumbent re-elected. |
|
| California 11 | Richard Pombo | Republican | 1992 | Incumbent re-elected. |
|
| California 12 | Tom Lantos | Democratic | 1980 | Incumbent re-elected. |
|
| California 13 | Pete Stark | Democratic | 1972 | Incumbent re-elected. |
|
| California 14 | Anna Eshoo | Democratic | 1992 | Incumbent re-elected. |
|
| California 15 | Norman Mineta | Democratic | 1974 | Incumbent re-elected. |
|
| California 16 | Don Edwards | Democratic | 1962 | Incumbent retired. New member elected. Democratic hold. |
|
| California 17 | Sam Farr | Democratic | 1993 | Incumbent re-elected. |
|
| California 18 | Gary Condit | Democratic | 1989 | Incumbent re-elected. |
|
| California 19 | Richard H. Lehman | Democratic | 1982 | Incumbent lost re-election. New member elected. Republican gain. |
|
| California 20 | Cal Dooley | Democratic | 1990 | Incumbent re-elected. |
|
| California 21 | Bill Thomas | Republican | 1978 | Incumbent re-elected. |
|
| California 22 | Michael Huffington | Republican | 1992 | Incumbent retired to run for U.S. Senator. New member elected. Republican hold. |
|
| California 23 | Elton Gallegly | Republican | 1992 | Incumbent re-elected. |
|
| California 24 | Anthony Beilenson | Democratic | 1976 | Incumbent re-elected. |
|
| California 25 | Buck McKeon | Republican | 1992 | Incumbent re-elected. |
|
| California 26 | Howard Berman | Democratic | 1982 | Incumbent re-elected. |
|
| California 27 | Carlos Moorhead | Republican | 1972 | Incumbent re-elected. |
|
| California 28 | David Dreier | Republican | 1980 | Incumbent re-elected. |
|
| California 29 | Henry Waxman | Democratic | 1974 | Incumbent re-elected. |
|
| California 30 | Xavier Becerra | Democratic | 1992 | Incumbent re-elected. |
|
| California 31 | Matthew G. Martínez | Democratic | 1982 | Incumbent re-elected. |
|
| California 32 | Julian Dixon | Democratic | 1978 | Incumbent re-elected. |
|
| California 33 | Lucille Roybal-Allard | Democratic | 1992 | Incumbent re-elected. |
|
| California 34 | Esteban Torres | Democratic | 1982 | Incumbent re-elected. |
|
| California 35 | Maxine Waters | Democratic | 1990 | Incumbent re-elected. |
|
| California 36 | Jane Harman | Democratic | 1992 | Incumbent re-elected. |
|
| California 37 | Walter R. Tucker III | Democratic | 1992 | Incumbent re-elected. |
|
| California 38 | Steve Horn | Republican | 1992 | Incumbent re-elected. |
|
| California 39 | Ed Royce | Republican | 1992 | Incumbent re-elected. |
|
| California 40 | Jerry Lewis | Republican | 1978 | Incumbent re-elected. |
|
| California 41 | Jay Kim | Republican | 1992 | Incumbent re-elected. |
|
| California 42 | George Brown Jr. | Democratic | 1962 1970 (retired) 1972 |
Incumbent re-elected. |
|
| California 43 | Ken Calvert | Republican | 1992 | Incumbent re-elected. |
|
| California 44 | Al McCandless | Republican | 1984 | Incumbent retired. New member elected. Republican hold. |
|
| California 45 | Dana Rohrabacher | Republican | 1988 | Incumbent re-elected. |
|
| California 46 | Bob Dornan | Republican | 1976 1982 (retired) 1984 |
Incumbent re-elected. |
|
| California 47 | Christopher Cox | Republican | 1988 | Incumbent re-elected. |
|
| California 48 | Ron Packard | Republican | 1982 | Incumbent re-elected. |
|
| California 49 | Lynn Schenk | Democratic | 1992 | Incumbent lost re-election. New member elected. Republican gain. |
|
| California 50 | Bob Filner | Democratic | 1992 | Incumbent re-elected. |
|
| California 51 | Duke Cunningham | Republican | 1990 | Incumbent re-elected. |
|
| California 52 | Duncan L. Hunter | Republican | 1980 | Incumbent re-elected. |
|
Colorado edit
| District | Incumbent | This race | |||
|---|---|---|---|---|---|
| Representative | Party | First elected |
Results | Candidates | |
| Colorado 1 | Pat Schroeder | Democratic | 1972 | Incumbent re-elected. |
|
| Colorado 2 | David Skaggs | Democratic | 1986 | Incumbent re-elected. |
|
| Colorado 3 | Scott McInnis | Republican | 1992 | Incumbent re-elected. |
|
| Colorado 4 | Wayne Allard | Republican | 1990 | Incumbent re-elected. |
|
| Colorado 5 | Joel Hefley | Republican | 1986 | Incumbent re-elected. |
|
| Colorado 6 | Daniel Schaefer | Republican | 1983 | Incumbent re-elected. |
|
Connecticut edit
| District | Incumbent | This race | |||
|---|---|---|---|---|---|
| Representative | Party | First elected |
Results | Candidates | |
| Connecticut 1 | Barbara B. Kennelly | Democratic | 1982 | Incumbent re-elected. |
|
| Connecticut 2 | Sam Gejdenson | Democratic | 1980 | Incumbent re-elected. |
|
| Connecticut 3 | Rosa DeLauro | Democratic | 1990 | Incumbent re-elected. |
|
| Connecticut 4 | Chris Shays | Republican | 1987 | Incumbent re-elected. |
|
| Connecticut 5 | Gary Franks | Republican | 1990 | Incumbent re-elected. |
|
| Connecticut 6 | Nancy Johnson | Republican | 1982 | Incumbent re-elected. |
|
Delaware edit
| District | Incumbent | This race | |||
|---|---|---|---|---|---|
| Representative | Party | First elected |
Results | Candidates | |
| Delaware at-large | Mike Castle | Republican | 1992 | Incumbent re-elected. |
|
Florida edit
| District | Incumbent | This race | |||
|---|---|---|---|---|---|
| Representative | Party | First elected |
Results | Candidates | |
| Florida 1 | Earl Hutto | Democratic | 1978 | Incumbent retired. New member elected. Republican gain. |
|
| Florida 2 | Pete Peterson | Democratic | 1990 | Incumbent re-elected. |
|
| Florida 3 | Corrine Brown | Democratic | 1992 | Incumbent re-elected. |
|
| Florida 4 | Tillie Fowler | Republican | 1992 | Incumbent re-elected. |
|
| Florida 5 | Karen Thurman | Democratic | 1992 | Incumbent re-elected. |
|
| Florida 6 | Cliff Stearns | Republican | 1988 | Incumbent re-elected. |
|
| Florida 7 | John Mica | Republican | 1992 | Incumbent re-elected. |
|
| Florida 8 | Bill McCollum | Republican | 1980 | Incumbent re-elected. |
|
| Florida 9 | Michael Bilirakis | Republican | 1982 | Incumbent re-elected. |
|
| Florida 10 | Bill Young | Republican | 1970 | Incumbent re-elected. |
|
| Florida 11 | Sam Gibbons | Democratic | 1962 | Incumbent re-elected. |
|
| Florida 12 | Charles Canady | Republican | 1992 | Incumbent re-elected. |
|
| Florida 13 | Dan Miller | Republican | 1992 | Incumbent re-elected. |
|
| Florida 14 | Porter Goss | Republican | 1988 | Incumbent re-elected. |
|
| Florida 15 | Jim Bacchus | Democratic | 1990 | Incumbent retired. New member elected. Republican gain. |
|
| Florida 16 | Tom Lewis | Republican | 1982 | Incumbent retired. New member elected. Republican hold. |
|
| Florida 17 | Carrie Meek | Democratic | 1992 | Incumbent re-elected. |
|
| Florida 18 | Ileana Ros-Lehtinen | Republican | 1989 (special) | Incumbent re-elected. |
|
| Florida 19 | Harry Johnston | Democratic | 1988 | Incumbent re-elected. |
|
| Florida 20 | Peter Deutsch | Democratic | 1992 | Incumbent re-elected. |
|
| Florida 21 | Lincoln Díaz-Balart | Republican | 1992 | Incumbent re-elected. |
|
| Florida 22 | Clay Shaw | Republican | 1980 | Incumbent re-elected. |
|
| Florida 23 | Alcee Hastings | Democratic | 1992 | Incumbent re-elected. |
|
Georgia edit
| District | Incumbent | This race | |||
|---|---|---|---|---|---|
| Representative | Party | First elected |
Results | Candidates | |
| Georgia 1 | Jack Kingston | Republican | 1992 | Incumbent re-elected. |
|
| Georgia 2 | Sanford Bishop | Democratic | 1992 | Incumbent re-elected. |
|
| Georgia 3 | Mac Collins | Republican | 1992 | Incumbent re-elected. |
|
| Georgia 4 | John Linder | Republican | 1992 | Incumbent re-elected. |
|
| Georgia 5 | John Lewis | Democratic | 1986 | Incumbent re-elected. |
|
| Georgia 6 | Newt Gingrich | Republican | 1978 | Incumbent re-elected. |
|
| Georgia 7 | George Darden | Democratic | 1983 | Incumbent lost re-election. New member elected. Republican gain. |
|
| Georgia 8 | J. Roy Rowland | Democratic | 1982 | Incumbent retired. New member elected. Republican gain. |
|
| Georgia 9 | Nathan Deal | Democratic | 1992 | Incumbent re-elected. |
|
| Georgia 10 | Don Johnson Jr. | Democratic | 1992 | Incumbent lost re-election. New member elected. Republican gain. |
|
| Georgia 11 | Cynthia McKinney | Democratic | 1992 | Incumbent re-elected. |
|
Hawaii edit
| District | Incumbent | This race | |||
|---|---|---|---|---|---|
| Representative | Party | First elected |
Results | Candidates | |
| Hawaii 1 | Neil Abercrombie | Democratic | 1986 (special) 1988 (lost renomination) 1990 |
Incumbent re-elected. |
|
| Hawaii 2 | Patsy Mink | Democratic | 1964 1976 (retired) 1990 (special) |
Incumbent re-elected. |
|
Idaho edit
| District | Incumbent | This race | |||
|---|---|---|---|---|---|
| Representative | Party | First elected |
Results | Candidates | |
| Idaho 1 | Larry LaRocco | Democratic | 1990 | Incumbent lost re-election. New member elected. Republican gain. |
|
| Idaho 2 | Mike Crapo | Republican | 1992 | Incumbent re-elected. |
|
Illinois edit
| District | Incumbent | This race | |||
|---|---|---|---|---|---|
| Representative | Party | First elected |
Results | Candidates | |
| Illinois 1 | Bobby Rush | Democratic | 1992 | Incumbent re-elected. |
|
| Illinois 2 | Mel Reynolds | Democratic | 1992 | Incumbent re-elected. |
|
| Illinois 3 | Bill Lipinski | Democratic | 1982 | Incumbent re-elected. |
|
| Illinois 4 | Luis Gutiérrez | Democratic | 1992 | Incumbent re-elected. |
|
| Illinois 5 | Dan Rostenkowski | Democratic | 1958 | Incumbent lost re-election. New member elected. Republican gain. |
|
| Illinois 6 | Henry Hyde | Republican | 1974 | Incumbent re-elected. |
|
| Illinois 7 | Cardiss Collins | Democratic | 1973 (special) | Incumbent re-elected. |
|
| Illinois 8 | Phil Crane | Republican | 1969 (special) | Incumbent re-elected. |
|
| Illinois 9 | Sidney R. Yates | Democratic | 1948 1962 (retired) 1964 |
Incumbent re-elected. |
|
| Illinois 10 | John Porter | Republican | 1980 | Incumbent re-elected. |
|
| Illinois 11 | George Sangmeister | Democratic | 1988 | Incumbent retired. New member elected. Republican gain. |
|
| Illinois 12 | Jerry Costello | Democratic | 1988 | Incumbent re-elected. |
|
| Illinois 13 | Harris Fawell | Republican | 1984 | Incumbent re-elected. |
|
| Illinois 14 | Dennis Hastert | Republican | 1986 | Incumbent re-elected. |
|
| Illinois 15 | Tom Ewing | Republican | 1991 | Incumbent re-elected. |
|
| Illinois 16 | Don Manzullo | Republican | 1992 | Incumbent re-elected. |
|
| Illinois 17 | Lane Evans | Democratic | 1982 | Incumbent re-elected. |
|
| Illinois 18 | Robert H. Michel | Republican | 1956 | Incumbent retired. New member elected. Republican hold. |
|
| Illinois 19 | Glenn Poshard | Democratic | 1988 | Incumbent re-elected. |
|
| Illinois 20 | Richard Durbin | Democratic | 1982 | Incumbent re-elected. |
|
Indiana edit
| District | Incumbent | This race | |||
|---|---|---|---|---|---|
| Representative | Party | First elected |
Results | Candidates | |
| Indiana 1 | Pete Visclosky | Democratic | 1984 | Incumbent re-elected. |
|
| Indiana 2 | Philip Sharp | Democratic | 1974 | Incumbent retired. New member elected. Republican gain. |
|
| Indiana 3 | Tim Roemer | Democratic | 1990 | Incumbent re-elected. |
|
| Indiana 4 | Jill L. Long | Democratic | 1989 | Incumbent lost re-election. New member elected. Republican gain. |
|
| Indiana 5 | Steve Buyer | Republican | 1992 | Incumbent re-elected. |
|
| Indiana 6 | Dan Burton | Republican | 1982 | Incumbent re-elected. |
|
| Indiana 7 | John T. Myers | Republican | 1966 | Incumbent re-elected. |
|
| Indiana 8 | Frank McCloskey | Democratic | 1982 | Incumbent lost re-election. New member elected. Republican gain. |
|
| Indiana 9 | Lee Hamilton | Democratic | 1964 | Incumbent re-elected. |
|
| Indiana 10 | Andrew Jacobs Jr. | Democratic | 1964 1972 (defeated) 1974 |
Incumbent re-elected. |
|
Iowa edit
| District | Incumbent | This race | |||
|---|---|---|---|---|---|
| Representative | Party | First elected |
Results | Candidates | |
| Iowa 1 | Jim Leach | Republican | 1976 | Incumbent re-elected. |
|
| Iowa 2 | Jim Nussle | Republican | 1990 | Incumbent re-elected. |
|
| Iowa 3 | Jim Ross Lightfoot | Republican | 1984 | Incumbent re-elected. |
|
| Iowa 4 | Neal Smith | Democratic | 1958 | Incumbent lost re-election. New member elected. Republican gain. |
Others
|
| Iowa 5 | Fred Grandy | Republican | 1986 | Incumbent retired to run for Governor of Iowa. New member elected. Republican hold. |
|
Kansas edit
| District | Incumbent | This race | |||
|---|---|---|---|---|---|
| Representative | Party | First elected |
Results | Candidates | |
| Kansas 1 | Pat Roberts | Republican | 1980 | Incumbent re-elected. |
|
| Kansas 2 | Jim Slattery | Democratic | 1982 | Incumbent retired to run for Governor of Kansas. New member elected. Republican gain. |
|
| Kansas 3 | Jan Meyers | Republican | 1984 | Incumbent re-elected. |
|
| Kansas 4 | Dan Glickman | Democratic | 1976 | Incumbent lost re-election. New member elected. Republican gain. |
|
Kentucky edit
| District | Incumbent | This race | |||
|---|---|---|---|---|---|
| Representative | Party | First elected |
Results | Candidates | |
| Kentucky 1 | Thomas Barlow | Democratic | 1992 | Incumbent lost re-election. New member elected. Republican gain. |
|
| Kentucky 2 | Ron Lewis | Republican | 1994 | Incumbent re-elected. |
|
| Kentucky 3 | Romano Mazzoli | Democratic | 1970 | Incumbent retired. New member elected. Democratic hold. |
|
| Kentucky 4 | Jim Bunning | Republican | 1986 | Incumbent re-elected. |
|
| Kentucky 5 | Hal Rogers | Republican | 1980 | Incumbent re-elected. |
|
| Kentucky 6 | Scotty Baesler | Democratic | 1992 | Incumbent re-elected. |
|
Louisiana edit
| District | Incumbent | This race | |||
|---|---|---|---|---|---|
| Representative | Party | First elected |
Results | Candidates | |
| Louisiana 1 | Bob Livingston | Republican | 1977 (special) | Incumbent re-elected. |
|
| Louisiana 2 | William Jefferson | Democratic | 1990 | Incumbent re-elected. |
|
| Louisiana 3 | Billy Tauzin | Democratic | 1980 | Incumbent re-elected. |
|
| Louisiana 4 | Cleo Fields | Democratic | 1992 | Incumbent re-elected. |
|
| Louisiana 5 | Jim McCrery | Republican | 1988 | Incumbent re-elected. |
|
| Louisiana 6 | Richard Baker | Republican | 1986 | Incumbent re-elected. |
|
| Louisiana 7 | Jimmy Hayes | Democratic | 1986 | Incumbent re-elected. |
|
Maine edit
| District | Incumbent | This race | |||
|---|---|---|---|---|---|
| Representative | Party | First elected |
Results | Candidates | |
| Maine 1 | Thomas Andrews | Democratic | 1990 | Incumbent retired to run for U.S. Senator. New member elected. Republican gain. |
|
| Maine 2 | Olympia Snowe | Republican | 1978 | Incumbent retired to run for U.S. Senator. New member elected. Democratic gain. |
|
Maryland edit
| District | Incumbent | This race | |||
|---|---|---|---|---|---|
| Representative | Party | First elected |
Results | Candidates | |
| Maryland 1 | Wayne Gilchrest | Republican | 1990 | Incumbent re-elected. |
|
| Maryland 2 | Helen Delich Bentley | Republican | 1984 | Incumbent retired to run for Governor of Maryland. New member elected. Republican hold. |
|
| Maryland 3 | Ben Cardin | Democratic | 1986 | Incumbent re-elected. |
|
| Maryland 4 | Albert Wynn | Democratic | 1992 | Incumbent re-elected. |
|
| Maryland 5 | Steny Hoyer | Democratic | 1981 | Incumbent re-elected. |
|
| Maryland 6 | Roscoe Bartlett | Republican | 1992 | Incumbent re-elected. |
|
| Maryland 7 | Kweisi Mfume | Democratic | 1986 | Incumbent re-elected. |
|
| Maryland 8 | Connie Morella | Republican | 1986 | Incumbent re-elected. |
|
Massachusetts edit
| District | Incumbent | This race | |||
|---|---|---|---|---|---|
| Representative | Party | First elected |
Results | Candidates | |
| Massachusetts 1 | John Olver | Democratic | 1991 | Incumbent re-elected. |
|
| Massachusetts 2 | Richard Neal | Democratic | 1988 | Incumbent re-elected. |
|
| Massachusetts 3 | Peter Blute | Republican | 1992 | Incumbent re-elected. |
|
| Massachusetts 4 | Barney Frank | Democratic | 1980 | Incumbent re-elected. |
|
| Massachusetts 5 | Marty Meehan | Democratic | 1992 | Incumbent re-elected. |
|
| Massachusetts 6 | Peter G. Torkildsen | Republican | 1992 | Incumbent re-elected. |
|
| Massachusetts 7 | Ed Markey | Democratic | 1976 | Incumbent re-elected. |
|
| Massachusetts 8 | Joseph P. Kennedy II | Democratic | 1986 | Incumbent re-elected. |
|
| Massachusetts 9 | Joe Moakley | Democratic | 1972 | Incumbent re-elected. |
|
| Massachusetts 10 | Gerry Studds | Democratic | 1972 | Incumbent re-elected. |
|
Michigan edit
| District | Incumbent | This race | |||
|---|---|---|---|---|---|
| Representative | Party | First elected |
Results | Candidates | |
| Michigan 1 | Bart Stupak | Democratic | 1992 | Incumbent re-elected. |
|
| Michigan 2 | Pete Hoekstra | Republican | 1992 | Incumbent re-elected. |
|
| Michigan 3 | Vern Ehlers | Republican | 1993 | Incumbent re-elected. |
|
| Michigan 4 | Dave Camp | Republican | 1990 | Incumbent re-elected. |
|
| Michigan 5 | James Barcia | Democratic | 1992 | Incumbent re-elected. |
|
| Michigan 6 | Fred Upton | Republican | 1986 | Incumbent re-elected. |
|
| Michigan 7 | Nick Smith | Republican | 1992 | Incumbent re-elected. |
|
| Michigan 8 | Bob Carr | Democratic | 1974 1980 (defeated) 1982 |
Incumbent retired to run for U.S. Senator. New member elected. Republican gain. |
|
| Michigan 9 | Dale Kildee | Democratic | 1976 | Incumbent re-elected. |
|
| Michigan 10 | David Bonior | Democratic | 1976 | Incumbent re-elected. |
|
| Michigan 11 | Joe Knollenberg | Republican | 1992 | Incumbent re-elected. |
|
| Michigan 12 | Sander Levin | Democratic | 1982 | Incumbent re-elected. |
Others
|
| Michigan 13 | William D. Ford | Democratic | 1964 | Incumbent retired. New member elected. Democratic hold. |
Others
|
| Michigan 14 | John Conyers | Democratic | 1964 | Incumbent re-elected. |
|
| Michigan 15 | Barbara-Rose Collins | Democratic | 1990 | Incumbent re-elected. |
Others
|
| Michigan 16 | John Dingell | Democratic | 1955 (Special) | Incumbent re-elected. |
|
Minnesota edit
| District | Incumbent | This race | |||
|---|---|---|---|---|---|
| Representative | Party | First elected |
Results | Candidates | |
| Minnesota 1 | Tim Penny | DFL | 1982 | Incumbent retired. New member elected. Republican gain. |
|
| Minnesota 2 | David Minge | DFL | 1992 | Incumbent re-elected. |
|
| Minnesota 3 | Jim Ramstad | Republican | 1990 | Incumbent re-elected. |
|
| Minnesota 4 | Bruce Vento | DFL | 1976 | Incumbent re-elected. |
|
| Minnesota 5 | Martin Olav Sabo | DFL | 1978 | Incumbent re-elected. |
|
| Minnesota 6 | Rod Grams | Republican | 1992 | Incumbent retired to run for U.S. Senator. New member elected. DFL gain. |
|
| Minnesota 7 | Collin Peterson | DFL | 1990 | Incumbent re-elected. |
|
| Minnesota 8 | Jim Oberstar | DFL | 1974 | Incumbent re-elected. |
|
Mississippi edit
| District | Incumbent | This race | |||
|---|---|---|---|---|---|
| Representative | Party | First elected |
Results | Candidates | |
| Mississippi 1 | Jamie Whitten | Democratic | 1941 | Incumbent retired. New member elected. Republican gain. |
|
| Mississippi 2 | Bennie Thompson | Democratic | 1993 | Incumbent re-elected. |
|
| Mississippi 3 | Sonny Montgomery | Democratic | 1966 | Incumbent re-elected. |
|
| Mississippi 4 | Michael Parker | Democratic | 1988 | Incumbent re-elected. |
|
| Mississippi 5 | Gene Taylor | Democratic | 1989 | Incumbent re-elected. |
|
Missouri edit
| District | Incumbent | This race | |||
|---|---|---|---|---|---|
| Representative | Party | First elected |
Results | Candidates | |
| Missouri 1 | Bill Clay | Democratic | 1968 | Incumbent re-elected. |
|
| Missouri 2 | Jim Talent | Republican | 1992 | Incumbent re-elected. |
|
| Missouri 3 | Dick Gephardt | Democratic | 1976 | Incumbent re-elected. |
|
| Missouri 4 | Ike Skelton | Democratic | 1976 | Incumbent re-elected. |
|
| Missouri 5 | Alan Wheat | Democratic | 1982 | Incumbent retired to run for U.S. Senator. New member elected. Democratic hold. |
|
| Missouri 6 | Pat Danner | Democratic | 1992 | Incumbent re-elected. |
|
| Missouri 7 | Mel Hancock | Republican | 1988 | Incumbent re-elected. |
|
| Missouri 8 | Bill Emerson | Republican | 1980 | Incumbent re-elected. |
|
| Missouri 9 | Harold Volkmer | Democratic | 1976 | Incumbent re-elected. |
|
Montana edit
| District | Incumbent | This race | |||
|---|---|---|---|---|---|
| Representative | Party | First elected |
Results | Candidates | |
| Montana at-large | Pat Williams | Democratic | 1978 | Incumbent re-elected. |
|
Nebraska edit
| District | Incumbent | This race | |||
|---|---|---|---|---|---|
| Representative | Party | First elected |
Results | Candidates | |
| Nebraska 1 | Doug Bereuter | Republican | 1978 | Incumbent re-elected. |
|
| Nebraska 2 | Peter Hoagland | Democratic | 1988 | Incumbent lost re-election. New member elected. Republican gain. |
|
| Nebraska 3 | Bill Barrett | Republican | 1990 | Incumbent re-elected. |
|
Nevada edit
| District | Incumbent | This race | |||
|---|---|---|---|---|---|
| Representative | Party | First elected |
Results | Candidates | |
| Nevada 1 | James Bilbray | Democratic | 1986 | Incumbent lost re-election. New member elected. Republican gain. |
|
| Nevada 2 | Barbara Vucanovich | Republican | 1982 | Incumbent re-elected. |
|
New Hampshire edit
| District | Incumbent | This race | |||
|---|---|---|---|---|---|
| Representative | Party | First elected |
Results | Candidates | |
| New Hampshire 1 | Bill Zeliff | Republican | 1990 | Incumbent re-elected. |
|
| New Hampshire 2 | Richard N. Swett | Democratic | 1990 | Incumbent lost re-election. New member elected. Republican gain. |
|
New Jersey edit
| District | Incumbent | This race | |||
|---|---|---|---|---|---|
| Representative | Party | First elected |
Results | Candidates | |
| New Jersey 1 | Rob Andrews | Democratic | 1990 | Incumbent re-elected. |
|
| New Jersey 2 | William J. Hughes | Democratic | 1974 | Incumbent retired. New member elected. Republican gain. |
|
| New Jersey 3 | Jim Saxton | Republican | 1984 | Incumbent re-elected. |
|
| New Jersey 4 | Chris Smith | Republican | 1980 | Incumbent re-elected. |
|
| New Jersey 5 | Marge Roukema | Republican | 1980 | Incumbent re-elected. |
|
| New Jersey 6 | Frank Pallone | Democratic | 1988 | Incumbent re-elected. |
|
| New Jersey 7 | Bob Franks | Republican | 1992 | Incumbent re-elected. |
|
| New Jersey 8 | Herb Klein | Democratic | 1992 | Incumbent lost re-election. New member elected. Republican gain. |
|
| New Jersey 9 | Robert Torricelli | Democratic | 1982 | Incumbent re-elected. |
|
| New Jersey 10 | Donald M. Payne | Democratic | 1988 | Incumbent re-elected. |
|
| New Jersey 11 | Dean Gallo | Republican | 1984 | Incumbent died November 6, 1994. New member elected. Republican hold. |
|
| New Jersey 12 | Dick Zimmer | Republican | 1990 | Incumbent re-elected. |
|
| New Jersey 13 | Bob Menendez | Democratic | 1992 | Incumbent re-elected. |
|
New Mexico edit
| District | Incumbent | This race | |||
|---|---|---|---|---|---|
| Representative | Party | First elected |
Results | Candidates | |
| New Mexico 1 | Steven Schiff | Republican | 1988 | Incumbent re-elected. |
|
| New Mexico 2 | Joe Skeen | Republican | 1980 | Incumbent re-elected. |
|
| New Mexico 3 | Bill Richardson | Democratic | 1982 | Incumbent re-elected. |
|
New York edit
| District | Incumbent | This race | |||
|---|---|---|---|---|---|
| Representative | Party | First elected |
Results | Candidates | |
| New York 1 | George J. Hochbrueckner | Democratic | 1986 | Incumbent lost re-election. New member elected. Republican gain. |
|
| New York 2 | Rick Lazio | Republican | 1992 | Incumbent re-elected. |
|
| New York 3 | Peter King | Republican | 1992 | Incumbent re-elected. |
|
| New York 4 | David A. Levy | Republican | 1992 | Incumbent lost renomination. New member elected. Republican hold. |
|
| New York 5 | Gary Ackerman | Democratic | 1983 | Incumbent re-elected. |
|
| New York 6 | Floyd Flake | Democratic | 1986 | Incumbent re-elected. |
|
| New York 7 | Thomas Manton | Democratic | 1984 | Incumbent re-elected. |
|
| New York 8 | Jerry Nadler | Democratic | 1992 | Incumbent re-elected. |
|
| New York 9 | Chuck Schumer | Democratic | 1980 | Incumbent re-elected. |
|
| New York 10 | Edolphus Towns | Democratic | 1982 | Incumbent re-elected. |
|
| New York 11 | Major Owens | Democratic | 1982 | Incumbent re-elected. |
|
| New York 12 | Nydia Velázquez | Democratic | 1992 | Incumbent re-elected. |
|
| New York 13 | Susan Molinari | Republican | 1990 | Incumbent re-elected. |
|
| New York 14 | Carolyn Maloney | Democratic | 1992 | Incumbent re-elected. |
|
| New York 15 | Charles Rangel | Democratic | 1970 | Incumbent re-elected. |
|
| New York 16 | José E. Serrano | Democratic | 1990 | Incumbent re-elected. |
|
| New York 17 | Eliot Engel | Democratic | 1988 | Incumbent re-elected. |
|
| New York 18 | Nita Lowey | Democratic | 1988 | Incumbent re-elected. |
|
| New York 19 | Hamilton Fish IV | Republican | 1968 | Incumbent retired. New member elected. Republican hold. |
|
| New York 20 | Benjamin Gilman | Republican | 1972 | Incumbent re-elected. |
|
| New York 21 | Michael McNulty | Democratic | 1988 | Incumbent re-elected. |
|
| New York 22 | Gerald Solomon | Republican | 1978 | Incumbent re-elected. |
|
| New York 23 | Sherwood Boehlert | Republican | 1982 | Incumbent re-elected. |
|
| New York 24 | John M. McHugh | Republican | 1992 | Incumbent re-elected. |
|
| New York 25 | James T. Walsh | Republican | 1988 | Incumbent re-elected. |
|
| New York 26 | Maurice Hinchey | Democratic | 1992 | Incumbent re-elected. |
|
| New York 27 | Bill Paxon | Republican | 1988 | Incumbent re-elected. |
|
| New York 28 | Louise Slaughter | Democratic | 1986 | Incumbent re-elected. |
|
| New York 29 | John LaFalce | Democratic | 1974 | Incumbent re-elected. |
|
| New York 30 | Jack Quinn | Republican | 1992 | Incumbent re-elected. |
|
| New York 31 | Amo Houghton | Republican | 1986 | Incumbent re-elected. |
|
North Carolina edit
| District | Incumbent | This race | |||
|---|---|---|---|---|---|
| Representative | Party | First elected |
Results | Candidates | |
| North Carolina 1 | Eva Clayton | Democratic | 1992 | Incumbent re-elected. |
|
| North Carolina 2 | Tim Valentine | Democratic | 1982 | Incumbent retired. New member elected. Republican gain. |
|
| North Carolina 3 | Martin Lancaster | Democratic | 1986 | Incumbent lost re-election. New member elected. Republican gain. |
|
| North Carolina 4 | David Price | Democratic | 1986 | Incumbent lost re-election. New member elected. Republican gain. |
|
| North Carolina 5 | Stephen L. Neal | Democratic | 1974 | Incumbent retired. New member elected. Republican gain. |
|
| North Carolina 6 | Howard Coble | Republican | 1984 | Incumbent re-elected. |
|
| North Carolina 7 | Charlie Rose | Democratic | 1972 | Incumbent re-elected. |
|
| North Carolina 8 | Bill Hefner | Democratic | 1974 | Incumbent re-elected. |
|
| North Carolina 9 | Alex McMillan | Republican | 1984 | Incumbent retired. New member elected. Republican hold. |
|
| North Carolina 10 | Cass Ballenger | Republican | 1986 | Incumbent re-elected. |
|
| North Carolina 11 | Charles Taylor | Republican | 1990 | Incumbent re-elected. |
|
| North Carolina 12 | Mel Watt | Democratic | 1992 | Incumbent re-elected. |
|
North Dakota edit
| District | Incumbent | This race | |||
|---|---|---|---|---|---|
| Representative | Party | First elected |
Results | Candidates | |
| North Dakota at-large | Earl Pomeroy | Democratic-NPL | 1992 | Incumbent re-elected. |
|
Ohio edit
| District | Incumbent | This race | |||
|---|---|---|---|---|---|
| Representative | Party | First elected |
Results | Candidates | |
| Ohio 1 | David S. Mann | Democratic | 1992 | Incumbent lost re-election. New member elected. Republican gain. |
|
| Ohio 2 | Rob Portman | Republican | 1993 | Incumbent re-elected. |
|
| Ohio 3 | Tony P. Hall | Democratic | 1978 | Incumbent re-elected. |
|
| Ohio 4 | Mike Oxley | Republican | 1981 | Incumbent re-elected. |
|
| Ohio 5 | Paul Gillmor | Republican | 1988 | Incumbent re-elected. |
|
| Ohio 6 | Ted Strickland | Democratic | 1992 | Incumbent lost re-election. New member elected. Republican gain. |
|
| Ohio 7 | Dave Hobson | Republican | 1991 | Incumbent re-elected. |
|
| Ohio 8 | John Boehner | Republican | 1990 | Incumbent re-elected. |
|
| Ohio 9 | Marcy Kaptur | Democratic | 1982 | Incumbent re-elected. |
|
| Ohio 10 | Martin Hoke | Republican | 1992 | Incumbent re-elected. |
|
| Ohio 11 | Louis Stokes | Democratic | 1968 | Incumbent re-elected. |
|
| Ohio 12 | John Kasich | Republican | 1982 | Incumbent re-elected. |
|
| Ohio 13 | Sherrod Brown | Democratic | 1992 | Incumbent re-elected. |
|
| Ohio 14 | Tom Sawyer | Democratic | 1986 | Incumbent re-elected. |
|
| Ohio 15 | Deborah Pryce | Republican | 1992 | Incumbent re-elected. |
|
| Ohio 16 | Ralph Regula | Republican | 1972 | Incumbent re-elected. |
|
| Ohio 17 | James Traficant | Democratic | 1984 | Incumbent re-elected. |
|
| Ohio 18 | Douglas Applegate | Democratic | 1976 | Incumbent retired. New member elected. Republican gain. |
|
| Ohio 19 | Eric Fingerhut | Democratic | 1992 | Incumbent lost re-election. New member elected. Republican gain. |
|
Oklahoma edit
| District | Incumbent | This race | |||
|---|---|---|---|---|---|
| Representative | Party | First elected |
Results | Candidates | |
| Oklahoma 1 | Jim Inhofe | Republican | 1986 | Incumbent retired to run for U.S. Senator. New member elected. Republican hold. |
|
| Oklahoma 2 | Mike Synar | Democratic | 1978 | Incumbent lost renomination. New member elected. Republican gain. |
|
| Oklahoma 3 | Bill Brewster | Democratic | 1990 | Incumbent re-elected. |
|
| Oklahoma 4 | Dave McCurdy | Democratic | 1980 | Incumbent retired to run for U.S. Senator. New member elected. Republican gain. |
|
| Oklahoma 5 | Ernest Istook | Republican | 1992 | Incumbent re-elected. |
|
| Oklahoma 6 | Frank Lucas | Republican | 1994 | Incumbent re-elected. |
|
Oregon edit
| District | Incumbent | This race | |||
|---|---|---|---|---|---|
| Representative | Party | First elected |
Results | Candidates | |
| Oregon 1 | Elizabeth Furse | Democratic | 1992 | Incumbent re-elected. |
|
| Oregon 2 | Bob Smith | Republican | 1982 | Incumbent retired. New member elected. Republican hold. |
|
| Oregon 3 | Ron Wyden | Democratic | 1980 | Incumbent re-elected. |
|
| Oregon 4 | Peter DeFazio | Democratic | 1986 | Incumbent re-elected. |
|
| Oregon 5 | Mike Kopetski | Democratic | 1990 | Incumbent retired. New member elected. Republican gain. |
|
Pennsylvania edit
| District | Incumbent | This race | |||
|---|---|---|---|---|---|
| Representative | Party | First elected |
Results | Candidates | |
| Pennsylvania 1 | Thomas M. Foglietta | Democratic | 1980 | Incumbent re-elected. |
|
| Pennsylvania 2 | Lucien Blackwell | Democratic | 1990 | Incumbent lost renomination. New member elected. Democratic hold. |
|
| Pennsylvania 3 | Robert Borski | Democratic | 1982 | Incumbent re-elected. |
|
| Pennsylvania 4 | Ron Klink | Democratic | 1992 | Incumbent re-elected. |
|
| Pennsylvania 5 | William Clinger | Republican | 1978 | Incumbent re-elected. |
|
| Pennsylvania 6 | Tim Holden | Democratic | 1992 | Incumbent re-elected. |
|
| Pennsylvania 7 | Curt Weldon | Republican | 1986 | Incumbent re-elected. |
|
| Pennsylvania 8 | Jim Greenwood | Republican | 1992 | Incumbent re-elected. |
|
| Pennsylvania 9 | Bud Shuster | Republican | 1972 | Incumbent re-elected. |
|
| Pennsylvania 10 | Joseph M. McDade | Republican | 1962 | Incumbent re-elected. |
|
| Pennsylvania 11 | Paul Kanjorski | Democratic | 1984 | Incumbent re-elected. |
|
| Pennsylvania 12 | John Murtha | Democratic | 1974 | Incumbent re-elected. |
|
| Pennsylvania 13 | Marjorie Margolies-Mezvinsky | Democratic | 1992 | Incumbent lost re-election. New member elected. Republican gain. |
|
| Pennsylvania 14 | William J. Coyne | Democratic | 1980 | Incumbent re-elected. |
|
| Pennsylvania 15 | Paul McHale | Democratic | 1992 | Incumbent re-elected. |
|
| Pennsylvania 16 | Bob Walker | Republican | 1976 | Incumbent re-elected. |
|
| Pennsylvania 17 | George Gekas | Republican | 1982 | Incumbent re-elected. |
|
| Pennsylvania 18 | Rick Santorum | Republican | 1990 | Incumbent retired to run for U.S. Senator. New member elected. Democratic gain. |
|
| Pennsylvania 19 | Bill Goodling | Republican | 1974 | Incumbent re-elected. |
|
| Pennsylvania 20 | Austin Murphy | Democratic | 1976 | Incumbent retired. New member elected. Democratic hold. |
|
| Pennsylvania 21 | Tom Ridge | Republican | 1982 | Incumbent retired to run for Governor of Pennsylvania. New member elected. Republican hold. |
|
Rhode Island edit
| District | Incumbent | This race | |||
|---|---|---|---|---|---|
| Representative | Party | First elected |
Results | Candidates | |
| Rhode Island 1 | Ronald Machtley | Republican | 1988 | Incumbent retired to run for Governor of Rhode Island. New member elected. Democratic gain. |
|
| Rhode Island 2 | Jack Reed | Democratic | 1990 | Incumbent re-elected. |
|
South Carolina edit
| District | Incumbent | This race | |||
|---|---|---|---|---|---|
| Representative | Party | First elected |
Results | Candidates | |
| South Carolina 1 | Arthur Ravenel Jr. | Republican | 1986 | Incumbent retired to run for Governor of South Carolina. New member elected. Republican hold. |
|
| South Carolina 2 | Floyd Spence | Republican | 1970 | Incumbent re-elected. |
|
| South Carolina 3 | Butler Derrick | Democratic | 1974 | Incumbent retired. New member elected. Republican gain. |
|
| South Carolina 4 | Bob Inglis | Republican | 1992 | Incumbent re-elected. |
|
| South Carolina 5 | John Spratt | Democratic | 1982 | Incumbent re-elected. |
|
| South Carolina 6 | Jim Clyburn | Democratic | 1992 | Incumbent re-elected. |
|
South Dakota edit
| District | Incumbent | This race | |||
|---|---|---|---|---|---|
| Representative | Party | First elected |
Results | Candidates | |
| South Dakota at-large | Tim Johnson | Democratic | 1986 | Incumbent re-elected. |
|
Tennessee edit
| District | Incumbent | This race | |||
|---|---|---|---|---|---|
| Representative | Party | First elected |
Results | Candidates | |
| Tennessee 1 | Jimmy Quillen | Republican | 1962 | Incumbent re-elected. |
|
| Tennessee 2 | Jimmy Duncan | Republican | 1988 | Incumbent re-elected. |
|
| Tennessee 3 | Marilyn Lloyd | Democratic | 1974 | Incumbent retired. New member elected. Republican gain. |
|
| Tennessee 4 | Jim Cooper | Democratic | 1982 | Incumbent retired to run for U.S. Senator. New member elected. Republican gain. |
|
| Tennessee 5 | Bob Clement | Democratic | 1988 | Incumbent re-elected. |
Others
|
| Tennessee 6 | Bart Gordon | Democratic | 1984 | Incumbent re-elected. |
|
| Tennessee 7 | Don Sundquist | Republican | 1982 | Incumbent retired to run for Governor of Tennessee. New member elected. Republican hold. |
|
| Tennessee 8 | John Tanner | Democratic | 1988 | Incumbent re-elected. |
|
| Tennessee 9 | Harold Ford Sr. | Democratic | 1974 | Incumbent re-elected. |
|
Texas edit
| District | Incumbent | This race | |||
|---|---|---|---|---|---|
| Representative | Party | First elected |
Results | Candidates | |
| Texas 1 | Jim Chapman | Democratic | 1985 | Incumbent re-elected. |
|
| Texas 2 | Charles Wilson | Democratic | 1972 | Incumbent re-elected. |
|
| Texas 3 | Sam Johnson | Republican | 1991 | Incumbent re-elected. |
|
| Texas 4 | Ralph Hall | Democratic | 1980 | Incumbent re-elected. |
|
| Texas 5 | John Bryant | Democratic | 1982 | Incumbent re-elected. |
Others
|
| Texas 6 | Joe Barton | Republican | 1984 | Incumbent re-elected. |
|
| Texas 7 | Bill Archer | Republican | 1970 | Incumbent re-elected. |
|
| Texas 8 | Jack Fields | Republican | 1980 | Incumbent re-elected. |
|
| Texas 9 | Jack Brooks | Democratic | 1952 | Incumbent lost re-election. New member elected. Republican gain. |
|
| Texas 10 | J. J. Pickle | Democratic | 1963 | Incumbent retired. New member elected. Democratic hold. |
|
| Texas 11 | Chet Edwards | Democratic | 1990 | Incumbent re-elected. |
|
| Texas 12 | Pete Geren | Democratic | 1989 | Incumbent re-elected. |
|
| Texas 13 | Bill Sarpalius | Democratic | 1988 | Incumbent lost re-election. New member elected. Republican gain. |
|
| Texas 14 | Greg Laughlin | Democratic | 1992 | Incumbent re-elected. |
|
| Texas 15 | Kika de la Garza | Democratic | 1964 | Incumbent re-elected. |
|
| Texas 16 | Ron Coleman | Democratic | 1982 | Incumbent re-elected. |
|
| Texas 17 | Charles Stenholm | Democratic | 1978 | Incumbent re-elected. |
|
| Texas 18 | Craig Washington | Democratic | 1989 | Incumbent lost renomination. New member elected. Democratic hold. |
|
| Texas 19 | Larry Combest | Republican | 1984 | Incumbent re-elected. |
|
| Texas 20 | Henry B. González | Democratic | 1961 | Incumbent re-elected. |
|
| Texas 21 | Lamar Smith | Republican | 1986 | Incumbent re-elected. |
|
| Texas 22 | Tom DeLay | Republican | 1984 | Incumbent re-elected. |
|
| Texas 23 | Henry Bonilla | Republican | 1992 | Incumbent re-elected. |
|
| Texas 24 | Martin Frost | Democratic | 1978 | Incumbent re-elected. |
|
| Texas 25 | Michael A. Andrews | Democratic | 1982 | Incumbent retired to run for U.S. Senator. New member elected. Democratic hold. |
|
| Texas 26 | Dick Armey | Republican | 1984 | Incumbent re-elected. |
|
| Texas 27 | Solomon Ortiz | Democratic | 1982 | Incumbent re-elected. |
|
| Texas 28 | Frank Tejeda | Democratic | 1992 | Incumbent re-elected. |
|
| Texas 29 | Gene Green | Democratic | 1992 | Incumbent re-elected. |
|
| Texas 30 | Eddie Bernice Johnson | Democratic | 1992 | Incumbent re-elected. |
|
Utah edit
| District | Incumbent | This race | |||
|---|---|---|---|---|---|
| Representative | Party | First elected |
Results | Candidates | |
| Utah 1 | Jim Hansen | Republican | 1980 | Incumbent re-elected. |
|
| Utah 2 | Karen Shepherd | Democratic | 1992 | Incumbent lost re-election. New member elected. Republican gain. |
|
| Utah 3 | Bill Orton | Democratic | 1990 | Incumbent re-elected. |
|
Vermont edit
| District | Incumbent | This race | |||
|---|---|---|---|---|---|
| Representative | Party | First elected |
Results | Candidates | |
| Vermont at-large | Bernie Sanders | Independent | 1990 | Incumbent re-elected. |
|
Virginia edit
| District | Incumbent | This race | |||
|---|---|---|---|---|---|
| Representative | Party | First elected |
Results | Candidates | |
| Virginia 1 | Herb Bateman | Republican | 1982 | Incumbent re-elected. |
|
| Virginia 2 | Owen B. Pickett | Democratic | 1986 | Incumbent re-elected. |
|
| Virginia 3 | Bobby Scott | Democratic | 1992 | Incumbent re-elected. |
|
| Virginia 4 | Norman Sisisky | Democratic | 1982 | Incumbent re-elected. |
|
| Virginia 5 | Lewis F. Payne Jr. | Democratic | 1988 | Incumbent re-elected. |
|
| Virginia 6 | Bob Goodlatte | Republican | 1992 | Incumbent re-elected. |
|
| Virginia 7 | Thomas J. Bliley Jr. | Republican | 1980 | Incumbent re-elected. |
|
| Virginia 8 | Jim Moran | Democratic | 1990 | Incumbent re-elected. |
Others
|
| Virginia 9 | Rick Boucher | Democratic | 1982 | Incumbent re-elected. |
|
| Virginia 10 | Frank Wolf | Republican | 1980 | Incumbent re-elected. |
|
| Virginia 11 | Leslie Byrne | Democratic | 1992 | Incumbent lost re-election. New member elected. Republican gain. |
|
Washington edit
| District | Incumbent | This race | |||
|---|---|---|---|---|---|
| Representative | Party | First elected |
Results | Candidates | |
| Washington 1 | Maria Cantwell | Democratic | 1992 | Incumbent lost re-election. New member elected. Republican gain. |
|
| Washington 2 | Al Swift | Democratic | 1978 | Incumbent retired. New member elected. Republican gain. |
|
| Washington 3 | Jolene Unsoeld | Democratic | 1988 | Incumbent lost re-election. New member elected. Republican gain. |
|
| Washington 4 | Jay Inslee | Democratic | 1992 | Incumbent lost re-election. New member elected. Republican gain. |
|
| Washington 5 | Tom Foley | Democratic | 1964 | Incumbent lost re-election. New member elected. Republican gain. |
|
| Washington 6 | Norm Dicks | Democratic | 1976 | Incumbent re-elected. |
|
| Washington 7 | Jim McDermott | Democratic | 1988 | Incumbent re-elected. |
|
| Washington 8 | Jennifer Dunn | Republican | 1992 | Incumbent re-elected. |
|
| Washington 9 | Mike Kreidler | Democratic | 1992 | Incumbent lost re-election. New member elected. Republican gain. |
|
West Virginia edit
| District | Incumbent | This race | |||
|---|---|---|---|---|---|
| Representative | Party | First elected |
Results | Candidates | |
| West Virginia 1 | Alan Mollohan | Democratic | 1982 | Incumbent re-elected. |
|
| West Virginia 2 | Bob Wise | Democratic | 1982 | Incumbent re-elected. |
|
| West Virginia 3 | Nick Rahall | Democratic | 1976 | Incumbent re-elected. |
|
Wisconsin edit
| District | Incumbent | This race | |||
|---|---|---|---|---|---|
| Representative | Party | First elected |
Results | Candidates | |
| Wisconsin 1 | Peter W. Barca | Democratic | 1993 (Special) | Incumbent lost re-election. New member elected. Republican gain. |
|
| Wisconsin 2 | Scott Klug | Republican | 1990 | Incumbent re-elected. |
|
| Wisconsin 3 | Steve Gunderson | Republican | 1980 | Incumbent re-elected. |
|
| Wisconsin 4 | Jerry Kleczka | Democratic | 1984 | Incumbent re-elected. |
|
| Wisconsin 5 | Tom Barrett | Democratic | 1992 | Incumbent re-elected. |
|
| Wisconsin 6 | Tom Petri | Republican | 1979 (Special) | Incumbent re-elected. |
|
| Wisconsin 7 | Dave Obey | Democratic | 1969 (Special) | Incumbent re-elected. |
|
| Wisconsin 8 | Toby Roth | Republican | 1978 | Incumbent re-elected. |
|
| Wisconsin 9 | Jim Sensenbrenner | Republican | 1978 | Incumbent re-elected. |
|
Wyoming edit
| District | Incumbent | This race | |||
|---|---|---|---|---|---|
| Representative | Party | First elected |
Results | Candidates | |
| Wyoming at-large | Craig L. Thomas | Republican | 1989 (Special) | Incumbent retired to run for U.S. Senator. New member elected. Republican hold. |
|
Non-voting delegates edit
| District | Incumbent | This race | |||
|---|---|---|---|---|---|
| Delegate | Party | First elected | Results | Candidates | |
| District of Columbia at-large | Eleanor Holmes Norton | Democratic | 1990 | Incumbent re-elected. |
|
| U.S. Virgin Islands at-large | Ron de Lugo | Democratic | 1980 | Incumbent retired. New member elected. Independent gain. |
|
| Guam at-large | Robert A. Underwood | Democratic | 1992 | Incumbent re-elected. |
|
See also edit
Notes edit
- ^ Stump was originally elected as a Democrat. He switched parties in 1982 and was re-elected as such that year.
References edit
- ^ Chard, R.E. (2004). The Mediating Effect of Public Opinion on Public Policy: Exploring the Realm of Health Care. State University of New York Press. p. 123. ISBN 9780791460535. Retrieved October 5, 2014.
- ^ "Thomas Foley, House Speaker, Dies at 84". The New York Times. October 18, 2013. Retrieved March 21, 2014.
- ^ Wayne, Stephen (2008). Parties and Elections in America: The Electoral Process Fifth Edition. Rowman & Littlefield.
- ^ Peter Applebome (November 11, 1994). "THE 1994 ELECTIONS: THE SOUTH; The Rising G.O.P. Tide Overwhelms the Democratic Levees in the South". The New York Times. Retrieved September 22, 2014.
- ^ Klinkner 118.
- ^ Hotline, November 12, 1994.
- ^ "Democratic Delegate Loses In U.S. Virgin Islands Runoff". The Washington Post. November 24, 1994. Archived from the original on November 7, 2012. Retrieved July 27, 2011.
Further reading edit
- Jenkins, Shannon; Roscoe, Douglas D.; Frendreis, John P.; Gitelson, Alan R. (2007). "Ten Years After the Revolution: 1994 and Partisan Control of Government". In Green, John C.; Coffey, Daniel J. (eds.). The State of the Parties (5th ed.). Lanham, MD: Rowman and Littlefield. ISBN 9780742553224.
- Klinkner, Philip A. (1996). Midterm: The Elections of 1994 in Context. Westview Press.
- Ladd, Everett Carll (1995). "The 1994 Congressional Elections: The Postindustrial Realignment Continues". Political Science Quarterly. 110 (1): 1–22. doi:10.2307/2152048. JSTOR 2152048.
- Steeper, F. (February 8, 1995). "This Swing is Different: Analysis of 1994 Election Exit Polls". The Cook Political Report.
- Teixeira, Ruy A. (1996). "The Economics of the 1994 Election and U.S. Politics Today". Challenge. 39 (1): 26–31. doi:10.1080/05775132.1996.11471888.
- Wattenberg, Martin P. (1999). "The Democrats' Decline in the House during the Clinton Presidency: An Analysis of Partisan Swings". Presidential Studies Quarterly. 29 (3): 685–689. doi:10.1111/j.0268-2141.2003.00057.x.
External links edit
- Statistics of the Congressional Election of November 8, 1994, Office of the Clerk U.S. House of Representatives